ecosistemas

ISSN 1697-2473

Open access / CC BY-NC 4.0

© 2025 The authors [ECOSISTEMAS is not responsible for the misuse of copyrighted material] / © 2025 Los autores [ECOSISTEMAS no se hace responsable del uso indebido de material sujeto a derecho de autor]


Ecosistemas 34(3): 2987 [September - December / septiembre - diciembre, 2025]: https://doi.org/10.7818/ECOS.2987


MONOGRAPHIC: Invasion ecology / MONOGRÁFICO: Ecología de las invasiones

Guest editors / Editores invitados: Jonatan Rodríguez y Luis González


RESEARCH ARTICLE  / ARTÍCULO DE INVESTIGACIÓN


Factors affecting the distribution of Vespa velutina reported nests: a management approach

Aarón Lagoa1.* ORCID logo, Iria Villar1 ORCID logo, Sandra V. Rojas-Nossa1 ORCID logo, Peter J. Kennedy2 ORCID logo, Salustiano Mato1 ORCID logo, Josefina Garrido1 ORCID logo


(1)    University of Vigo, Department of Ecology and Animal Biology, 36310-Vigo (Pontevedra), Spain.

(2)    Environment and Sustainability Institute, University of Exeter, Penryn, Cornwall TR10 9FE, UK. 

* Corresponding author / Autor para correspondencia: Aarón Lagoa [aaron.lagoa@uvigo.gal]

> Received / Recibido: 12/03/2025 – Accepted / Aceptado: 13/08/2025

How to cite / Cómo citar: Lagoa, A., Villar, I., Rojas-Nossa, S.V., Kennedy, P.J., Mato, S., Garrido, J. 2025. Factors affecting the distribution of Vespa velutina reported nests: a management approach. Ecosistemas 34(3): 2987. https://doi.org/10.7818/ECOS.2987  

Factors affecting the distribution of Vespa velutina reported nests: a management approach

Abstract: Vespa velutina nigritorax Buysson, 1905, is considered one of the most harmful invasive species in Europe. Since its introduction, it has caused numerous instances of human, economic, and ecosystem damage. To address its rapid spread, monitoring programmes have been implemented, many relying on citizen-reported data, however, the invaded range continues to expand. In this study, we aimed to improve the knowledge about V. velutina spatial preferences and activity periods to support the development of more effective management measures. We analysed the extent to which citizen-reported nests could be explained by human population density, land cover and altitude in Galicia (NW Spain). In 2021, we conducted an intensive assessment of nest density in a Galician coniferous forest, and we compared it with nest density obtained by citizen reports. We also monitored hornet activity at nests from October to December 2021 in their natural environment. Our analysis revealed that higher human population density, urban land cover, and altitude were the main factors that explained nest notifications in Galicia. Reported nests in coniferous forests underestimate at least five-fold the densities found in this study. Finally, nest activity declined late in the season, and observation times need to be extended during such periods of low activity to ensure representative sampling. These findings can help to implement appropriate management measures focusing more attention on nests in forest areas and extending the nest removal period.

Keywords: asian hornet; invasion; land use; monitoring; nest distribution

Factores que afectan a la distribución de nidos de Vespa velutina notificados: un enfoque de gestión

Resumen: Vespa velutina nigritorax Buysson, 1905, es una de las especies invasoras más perjudiciales en Europa. Desde su introducción, ha causado numerosos daños humanos, económicos y ecosistémicos. Para combatir su rápida dispersión, se han implementado programas de vigilancia, muchos de ellos basados en datos aportados por la ciudadanía, sin embargo, la especie continúa expandiéndose. Este estudio pretende ampliar el conocimiento sobre las preferencias espaciales y periodos de actividad de V. velutina para el manejo efectivo de la invasión. Se analizó en qué medida la densidad poblacional humana, el uso del suelo y la altitud influyen en las notificaciones de nidos en Galicia (NO España). En 2021, se realizó una evaluación exhaustiva de la densidad de nidos en un bosque gallego de coníferas y se compararon los datos con las notificaciones ciudadanas. También se monitoreó la actividad de los nidos de octubre a diciembre de 2021 en su emplazamiento natural. Los análisis revelaron que una mayor densidad poblacional humana, el suelo urbano y la altitud son los principales factores que explican la distribución de las notificaciones de nidos en Galicia. Los nidos reportados en bosques de coníferas subestiman al menos cinco veces las densidades encontradas en este estudio. Finalmente, la actividad de los nidos decae al final de la temporada, siendo necesaria la ampliación del tiempo de observación para asegurar la estimación representativa de la actividad del nido. Estos resultados pueden ayudar a aplicar medidas de gestión adecuadas, centrando mayor atención en los nidos de las zonas forestales y prolongando su retirada.

Palabras clave: avispón asiático; invasión; uso del suelo; monitoreo; distribución de nidos


Introduction

Vespa velutina nigritorax Buysson, 1905 was the first predator from the Vespidae family accidentally introduced into Europe from Asia (Monceau et al. 2014) and it rapidly become an invasive species (Regulation (EU) nº 2016/1141 of the Council, of July 13, 2016). The first sightings in Europe date back to 2004, in southwestern France, likely due to the arrival of a single fertilized queen (Dillane et al. 2022), probably through shipping trade (Monceau et al. 2014). In subsequent years, the population expanded its invaded range due to its ability to adapt to the new climate and environment (Monceau et al. 2014). It extends mainly along the Atlantic coast due to mild temperatures and high rainfall, while the higher temperatures of the Mediterranean coasts limit its spread (Bessa et al. 2016).

The first sightings of V. velutina in Spain were recorded in 2010, in Navarra and the Basque Country (Castro and Pagola-Carte 2010). It quickly spread throughout the north of the Iberian Peninsula, reaching Galicia in 2012 via the Spanish coastline, while also arriving from northern Portugal (Grosso-Silva and Maia 2012; Rodríguez-Flores et al. 2019). Thus, its population grew rapidly, colonising a large part of Galicia and causing important impacts at different levels: human, due to stings, economic, affecting the beekeeping sector and causing damage to agriculture, and ecosystemic, because the species affects pollination services, predation on other insects and competition for food sources (Laurino et al. 2019; Rojas-Nossa et al. 2021).

 Although V. velutina is highly adaptable to new environments (Monceau et al. 2014), climate appears to be the primary factor influencing its large-scale distribution in the Iberian Peninsula, surpassing land use and urbanization levels (Bessa et al. 2016). In this way, temperature and humidity favour colony establishment while altitude limits it (Rodríguez-Flores et al. 2019). Coastal zones are particularly suitable for its establishment due to the higher precipitation during the driest months (Villemant et al. 2011a) and increased access to feeding resources derived from tourism and fishing activities (Monceau et al. 2017). Topography can also affect the geographical distribution of the species, as mountains have likely limited the advance of the invasion to inland areas, while valleys may serve as corridors facilitating its expansion (Carvalho et al. 2020).

Regarding its life cycle, it is largely determined by climatic conditions (Barbet-Massin et al. 2020); therefore, the temperate climate of Galicia favours the species by prolonging its life cycle (Diéguez-Antón et al. 2022). During this cycle, V. velutina nests and populations grow along the season reaching their peak in autumn, when gynes and males emerge from the nests and mate (Monceau et al. 2014). Males subsequently die and fertilised gynes move to overwintering refuges. This crucial process ensures the successful survival of the species into the next year. Numerous studies have documented the life cycle of the species (Perrard et al. 2009; Monceau et al. 2017; Poidatz et al. 2018), but few have monitored nest activities late in the season and, as far as we are aware, none with nests in natural placement. Knowing the nest activity evolution throughout the season provides information about the species behaviour and helps in the implementation of actions on nest reports.

Regarding nest density, most studies have reported higher densities of V. velutina in urban and peri-urban areas than in forested regions, suggesting that the species prefers urban environments for nesting (Villemant et al. 2011b; Choi et al. 2012b; Franklin et al. 2017). These differences may be attributed to nests being more detectable in urban environments or urban environments being subjected to observer bias (Franklin et al. 2017). As the hornet’s prey spectrum is influenced by its nest surroundings, forest colonies prey more on social wasps while urban colonies prey more on honeybees (Rome et al. 2021); the latter, strongly affects the beekeeping economy (Monceau et al. 2014) and draws much of the research effort. Nevertheless, Rojas-Nossa et al. (2018) found that the number of queens trapped in spring was higher in forested areas, suggesting that nest densities in forests might be greater than previously assumed. These previous findings highlight the importance of estimating actual nest densities in forests and understanding potential biases in citizen-reported nest data.

The eradication of the species in the invaded area is considered impossible (Robinet et al. 2017). Therefore, governments need to manage efforts in controlling the invasion due to the considerable costs of nest removal (Barbet-Massin et al. 2020) and the limited budget to combat it. Active community engagement is an important aspect of the management of the V. velutina invasion in Galicia (Pazos et al. 2022). The early identification, reporting, and removal of nests are of critical importance to mitigate the negative impact of this invasive species, thereby reducing costs and optimising resources. The aim of this work is to improve the knowledge about V. velutina spatial preferences and activity period to support the implementation of more effective management measures in nest detectability and removal. The specific objectives are (1) to address the factors related to the distribution of citizen reported nest data that provide information about nest detectability; (2) to compare nest densities in coniferous forest between citizen-reported data and intensive sampling via radio-tracking to assess a possible underrepresentation of nests in forestry lands by current reporting programs, and (3) to assess the decline in nest activity late in the season under natural conditions and evaluate the suitability of the monitoring method, to improve knowledge about nest collapse and support decision-making. Based on this information, we hypothesized that community engagement provides biased information about V.velutina distribution and densities, underestimating the number of nests in non-urban areas. Moreover, due to the favourable climatic conditions in Galicia we expected that nests activities could be prolonged until late autumn.

Material and methods

Study area  

The objectives of this study were addressed at three different spatial scales (Galicia, Pontevedra and Vigo) and with two different types of data (nest locations and nests activities). The study of the distribution of citizen reported nest data was conducted at the regional level, specifically within the Autonomous Community of Galicia. This region is situated in the northwestern Iberian Peninsula (Fig. 1a) with a surface area of 29 575 km2 and a population of 2.7 million inhabitants. It has three different climatic areas according to Köppen 's classification: warm-summer Mediterranean climate (Csb), temperate Oceanic climate (Cfb) and hot-summer Mediterranean climate (Csa) and the vegetation is very diverse, however, Atlantic forests are dominant.

In turn, radio-tracking and monitoring of nests activities were conducted in the Galician municipality of Vigo situated in the Pontevedra province (Figs. 1b, 1c). It had a human population of 293 837 inhabitants in the year 2021 (INE 2023), being the most populated municipality in Galicia. According to Köppen 's classification, Vigo has a warm-summer Mediterranean climate (Csb) with high pluviosity and records of almost 2000 mm per year. The study area was outside the city, approximately at 6 km from city centre and at an altitude of between 300 to 500 m above sea level. It was composed of a continuous forest dominated by the tree species Pinus pinaster Aiton and Eucalyptus globulus Labill and to a lesser extent Castanea sativa Mill. and Quercus robur (Ten.) A. DC. According to the Corine Land Cover classification, it is categorised as a coniferous forest, which composes 24 % of the Galician forests. In addition, the area has numerous streams that provide water all year round and can encourage the development of nests and nesting sites. (Monceau et al. 2014).


a) Location of Autonomous Community of Galicia, its provinces and the city of Vigo; b) Location of radio-tracking searching area in the municipality of Vigo; c) Radio-tracking searching area with the nests found (asterisks) and the protein feeders (empty dots) (Coordinates UTM 29 N).


Figure 1. a) Location of Autonomous Community of Galicia, its provinces and the city of Vigo; b) Location of radio-tracking searching area in the municipality of Vigo; c) Radio-tracking searching area with the nests found (asterisks) and the protein feeders (empty dots) (Coordinates UTM 29 N).

Figura 1. a) Localización de la comunidad autónoma de Galicia, sus provincias y la ciudad de Vigo; b) Localización del área de búsqueda de radio seguimiento en el municipio de Vigo; c) Área de búsqueda mediante radio seguimiento con los nidos encontrados (asteriscos) y los cebaderos proteicos (puntos vacíos) (Coordenadas UTM 29 N).

Factors related to citizen reported nest data distribution

A georeferenced nest database of Galicia for the year 2020 (Xunta de Galicia, unpublished data) was used. This database contains the locations of nests reported by citizens via telephone at the centralised number of the Xunta de Galicia (012) and was anonymised before being provided to the authors. Of the 28 376 nests notified in 2020, data lacking coordinates (4088 nests) or corresponding to municipalities not assigned to the centralised number of the Xunta de Galicia were removed. Nest data were checked to avoid repeated reports. To carry out the analysis, the territory of Galicia was divided into 1 km x 1 km grid cells. The final working database contained 24 288 nests in 29 120 grids. Nest locations were modelled using the following variables: altitude (IGN 2022b) and mean temperature (years 1970-2000) (Fick and Hijmans 2017) - because they were good climate estimators - land cover in 2018 provided by the Corine Land Cover (IGN 2022a) and human population density in 2020 (IGE 2022). In accordance with confidentiality protocols, population grids with less than 20 inhabitants could not be provided by administrations and were considered to include no inhabitants in the statistical analyses.

Comparison of reported nest densities with those found by means of radio-tracking in a coniferous forest

The nest search was conducted in the summer of 2021 from June 23rd to September 16th, in an area of 1.5 km2 using a combination of two methods: one developed for nest detection in high density areas, which uses protein feeder as lures to estimate likely position of nests (Rojas-Nossa et al. 2022) and radio-tracking (Kennedy et al. 2018). This was done to avoid finding the same nest several times and to choose the best specimen to carry the transmitter.

In the study area, 11 protein feeders comprising in chicken legs were placed at different times during the summer to attract V. velutina workers (Fig. 1c). These are responsible for providing food for the larvae, which need a high protein intake for their development (Matsuura and Yamane 1990). The hornets were able to locate the protein feeders, collect pieces of the chicken and return to the nest, establishing a preferred and repeatedly used route between the protein source and the nest. To facilitate this process, the protein feeder was set up the day before the nest search, and only one location was used at a time.

The first part of the nest search was carried out between 10 a.m. and 2 p.m. CEST. During this period, individual hornets were captured at the protein feeder and individually weighed with a precision balance (Ohaus portable balance Scout® SKX123 120 g /0.001 g) to the nearest milligram. An individual’s weight was used to decide whether it was considered suitable for tracking. The hornet had to weigh more than 1.33 times the weight of the transmitter to be considered suitable to use (Kennedy et al. 2018). Hornets that met this condition were marked with nail polish, using a combination of colours on the thorax and abdomen to create a unique code, before being released again. Directions and times to return were recorded to estimate nest probable area according to the formula provided by Rojas-Nossa et al. (2022). Individuals for which we were able to obtain at least three replicate times and directions, that suggested their nests were likely within the sampling area, were selected for radio-tracking.

The second part of nest search was radio-tracking process. Selected individuals were recaptured and reweighed to confirm their suitability to carry the transmitter. One selected hornet per day was then placed in a tube and buried under crushed ice inside an ice cooler (Coleman Ploylite 5) between 7 to 14 minutes to anaesthetise it. While anaesthetised, the hornet was secured on a specifically designed plate to restrain the hornet while attaching a transmitter to its petiole with Kevlar thread (‎Material Metrics ‎KEVT40Y150) and a droplet of super glue (Loctite Super Glue-3) to secure the knot (Kennedy et al. 2018). Transmitters used for radio tracking were Biotrack Pip19/Ag190 (250 mg), Biotrack PicoPip/Ag337 (290 mg) and ATS T15 (173 mg). The choice of the transmitter model was determined by the weight of the hornet. After transmitter attachment, specimen recovery was enhanced by feeding the hornet with honey and then it was placed inside a recovery cage for 10 to 20 minutes. Each individual was released near the protein feeder it was caught at and followed to its nest with a Biotrack Sika VHF receiver and Biotrack Yagi flexible antenna. When the nest was found, it was geolocated (GPS Garmin etrex 30x).

Monitoring nests activities

Three nests were selected from those located by radio-tracking to monitor hornet activity from September 30th to December 15th, 2021. The selection was based on the visibility of the nest entrance hole from the ground (Fig. 2). Recorded observations were made with a Panasonic HC-X1000 camera from locations that ensured there was no obstacle between the camera and the nest. Recordings at each nest were made in five sets, approximately two weeks apart. Each set consisted of recordings over three days, with four 5-minute videos taken on each day, according to a schedule proposed by Monceau et al. (2017). In January 2022, one month after the last observation, a final check of each nest was made to confirm there was no activity.

All recordings were made between 12 noon and 2 p.m. CEST and, from November 1st with the seasonal time change, between 11 a.m. and 1 p.m. CET, as around noon was considered the daily period with the greatest hornet activity at nests (Monceau et al. 2017). In addition, recordings were not conducted on rainy days to prevent suppressed activity.

Five-minute videos were reviewed in the laboratory to evaluate nest activity evolution over the season. The number of exits of hornets from the nest was considered, because Monceau et al. (2017) determined that there were no significant differences between number of exits and the number of entrances and counting exits was considered easier.

Nests used for nest activity recordings. In each nest, the entrance hole is marked with an arrow and in the upper right part of each photograph the nest identifier: N1, N2 and N3 (photographs made by A. Lagoa with Panasonic HC-X1000 camera).

Figure 2. Nests used for nest activity recordings. In each nest, the entrance hole is marked with an arrow and in the upper right part of each photograph the nest identifier: N1, N2 and N3 (photographs made by A. Lagoa with Panasonic HC-X1000 camera).

Figura 2. Nidos utilizados para las grabaciones de actividades. En cada nido la entrada está marcada con una flecha y en la parte superior de cada fotografía aparece la identificación del nido: N1, N2 y N3 (las fotografías las realizó A. Lagoa con una cámara Panasonic HC-X1000).

Data analysis

To assess what factors affects to citizen reported nest data distribution, zero-inflated negative binomial regression (ZINB) was carried out, with the number of nests as the dependent variable and inhabitants, altitude, temperature, and land cover (urban, forestry and agricultural) as response variables. Land uses corresponded to level 1 classification of Corine Land Cover and were added to the model as the proportion of area covered by each land use per grid. Model comparison and selection was based on the Akaike Information Criterion (AIC). Mean temperature (1970-2000) was removed from the model as it did not provide a better model fit and forestry land cover due to multicollinearity with agricultural land cover. Data processing and maps were generated with QGIS 3.16.11 software, while statistical analysis was performed using R version 2.1.1 (R Core Team 2022) and the packages “MASS” (Venables and Ripley 2002) and “pscl” (Zeileis et al. 2008). The 95 % confidence interval was used for statistical tests.

The nest density (nests/Km2) found in the sampled area of the coniferous forest in the year 2021 was compared with nest densities data calculated from citizen reports provided by the Xunta de Galicia for the year 2020. Data for the year 2021 could not be used due to the absence of coordinates in the official database, but the number of nests reported (28 360) was almost the same as 2020 (28 376) and the reporting system was the same. The nest density was assessed across three different land use types: coniferous forest, continuous urban fabric, and discontinuous urban fabric. Nest density was also considered at three different spatial scales: for the community of Galicia, the province of Pontevedra and the municipality of Vigo. For this purpose, land uses provided by the Corine Land Cover for the year 2018 were used. In this way, it was possible to compare densities reported by the Xunta de Galicia with the intensive sampling from the 1.5 km2 Galician coniferous forest. Data processing was carried out with QGIS 3.16.11 software.

Nest activity data analysis was performed using a generalized additive model (GAM) with negative binomial family distribution to capture the overdispersion in data. The model included smooth terms for date by nest and a fixed effect for nests to account for group-level differences. It was fitted using Restricted Maximum Likelihood (REML) from the “mgcv” package in R (Wood 2017). Model adequacy was evaluated using gam.check() and residual diagnostics from the “DHARMa” package (Hartig 2016). Statistical analysis was performed using R version 2.1.1 (R Core Team 2022), and a 95 % confidence interval was used in the statistical tests.

To evaluate the sampling time necessary to estimate nest activity, a descriptive analysis of the data was carried out based on 5-minute videos of each recording set. The coefficient of variation was used to judge confidence in the estimate of nest activity throughout the season.

Results

Factors related to citizen reported nest data distribution

Of the 24 288 nests reported in 2020, 25 % were located in urban areas, 57 % in agricultural areas and 18 % in forested areas. The count section of ZINB regression showed that high human population densities and the presence of agricultural and urban areas favoured a greater number of nest reports, while high altitude led to fewer nests reported. Meanwhile, zero-inflation section of ZINB regression showed that only higher altitude increased the likelihood of no nests reported and human population density and the presence of urban and agricultural areas decreased the odds of no nest reports (Tabla 1; Fig. 3). Exponentiated coefficients from the ZINB model are showed in Appendix (Tabla A1).

Table 1. Results from the ZINB model of reported nests showing coefficient estimates, standard errors, z-values, and p-values.

Tabla 1. Resultados del modelo ZINB de nidos reportados que muestra las estimaciones de los coeficientes, errores estándar, valores z y valores p.

Count model

Estimate

Std. Error

z value

Pr(>|z|)

ZINB model

(Intrercept)

0.838  

0.036

22.840

< 0.001 ***

Human population

<0.001

<0.001

4.319

< 0.001 ***

Altitude

-0.003

<0.001

-35.211

< 0.001 ***

Agricultural land use

1.044

0.056

18.771

< 0.001 ***

Urban land use

2.276

0.108

20.997

< 0.001 ***

Zero-inflation model

(Intrercept)

0.498

0.070

7.147

< 0.001 ***

Human population

-0.056

0.002

-23.122

< 0.001 ***

Altitude

0.002

<0.001

12.037

< 0.001 ***

Agricultural land use

-0.662

0.119

-5.564

< 0.001 ***

Urban land use

-1.260

0.417

-3.019

0.002 **


a) Vespa velutina nests density in year 2020; b) Galician human population distribution in year 2020; c) altitude of Galicia; d) land cover. In grey are marked municipalities that did not report any data to 2020 Xunta de Galicia database (Coordinates UTM 29 N)


Figure 3. a) Vespa velutina nests density in year 2020; b) Galician human population distribution in year 2020; c) altitude of Galicia; d) land cover. In grey are marked municipalities that did not report any data to 2020 Xunta de Galicia database (Coordinates UTM 29 N).

Figura 3. a) Densidad de nidos de Vespa velutina en el año 2020; b) Distribución de la población humana gallega en el año 2020; c) altitud de Galicia; d) usos del suelo. En gris están marcados los municipios que no reportaron ningún dato a la base de datos de la Xunta de Galicia en el año 2020 (Coordenadas UTM 29 N).

Comparison of reported nest densities with those found by means of radio-tracking in a coniferous forest

In the summer of 2021, eight nests were found using radio-tracking, and one more was found visually in the sampling area all of them aerial: six in pine trees, two in eucalyptus and one in American oak. Nest densities found in the coniferous forest in 2021 were higher than those reported by the Xunta de Galicia for the same land use in 2020. The intensive sampling conducted in the summer of 2021 showed that nest density was almost six times greater, at 6 nests/km2, than in the previous year according to the Xunta de Galicia database (Fig. 4). Nest densities in continuous and discontinuous urban areas were higher than those obtained in the coniferous forest areas, ranging from 9.5 to 15.4 nests/km2 in Galicia, Pontevedra and Vigo. However, due to the application of the method using directions and timings (Rojas-Nossa et al. 2022) we can estimate that the number of nests in the sampling area may be higher than 6 nests/km2.


Relation between nests exits (Exits) (black continuous line) and coefficient of variation (CoefV) (grey dotted line) of the three nests studied N1 (●), N2 (▲), and N3 (■) grouped by recording sets. Error bars represent standard deviation of data (N=12)


Figure 4. Variation of nest density of Vespa velutina across three CLC land uses: coniferous forest, continuous urban fabric, and discontinuous urban fabric, for Galicia region, the province of Pontevedra and the city of Vigo during year 2020, based on citizen-reported nest data. An additional bar represents nest density in the sampled area (coniferous forest) in year 2021 with exhaustive nest searching.

Figura 4. Variación de la densidad de nidos de Vespa velutina en tres tipos de uso del suelo según el CLC: bosque de coníferas, tejido urbano continuo y tejido urbano discontinuo, para la región de Galicia, la provincia de Pontevedra y la ciudad de Vigo durante el año 2020, según datos facilitados por los ciudadanos. Una barra adicional representa la densidad de nidos en la zona muestreada (bosque de coníferas) en el año 2021 mediante la búsqueda exhaustiva de nidos

Monitoring nest entrance activities

The GAM model of nest exits showed differences in activities due to the nest recorded and the nest and date interaction. Passage of time favours the decrease in activity of all nests, being all results statistically significant (P < 0.01). Recordings made in January 2022 confirmed the collapse of the three colonies in that month. Model values are shown in Table 2.

Table 2. Results from the GAM model of nest hornet exits showing coefficient estimates, standard errors, z-values, and p-values from parametric coefficients and Effective Degrees of Freedom (edf), Reference Degrees of Freedom (Ref. df), Chi squared and p- value from smooth terms.

Tabla 2. Resultados del modelo GAM de salidas de avispones del nido que muestra las estimaciones de los coeficientes, errores estándar, valores z y valores p para los coeficientes paramétricos y los Grados de Libertad Efectivos (edf) Grados de Libertad de Referencia (Ref. df), Chi cuadrado y valor p para los términos suavizados.

GAM model

Parametric coefficients

Estimate

Std. Error

z value

Pr(>|z|)

Intercept

3.32

0.032

103.13

< 0.001 ***

Nest 2

-1.25

0.160

-7.82

< 0.001 ***

Nest 3

0.71

0.041

17.39

< 0.001 ***

Smooth terms

edf

Ref. df

Chi. sq

p-value

S(Date): Nest 1

3.86

4.59

300.8

< 0.001 ***

S(Date): Nest 2

5.79

6.53

840.4

< 0.001 ***

S(Date): Nest 3

1.02

1.04

664.4

< 0.001 ***

Nest 3 had the highest activity throughout the studied season, with the highest overall activity on the first day of recording (Fig. 5). Its activity decreased by 87 % between the first and last day. Nest 2 was the second most active nest during the first set of recordings but then showed a sharp (70 %) decline in activity, which stopped completely during the final set of recordings. Nest 1 had the least variation in activity over time. Its maximum activity was achieved during the second set of recordings, and at the end of the recordings it reduced its activity by 86 %.

The coefficient of variation increased as nest activity decreased with a recording time of 5 minutes (Fig 5). The coefficient of variation for nest 2 is not shown for the final recording set as only a single exit was registered in any 5-minute video in that set.
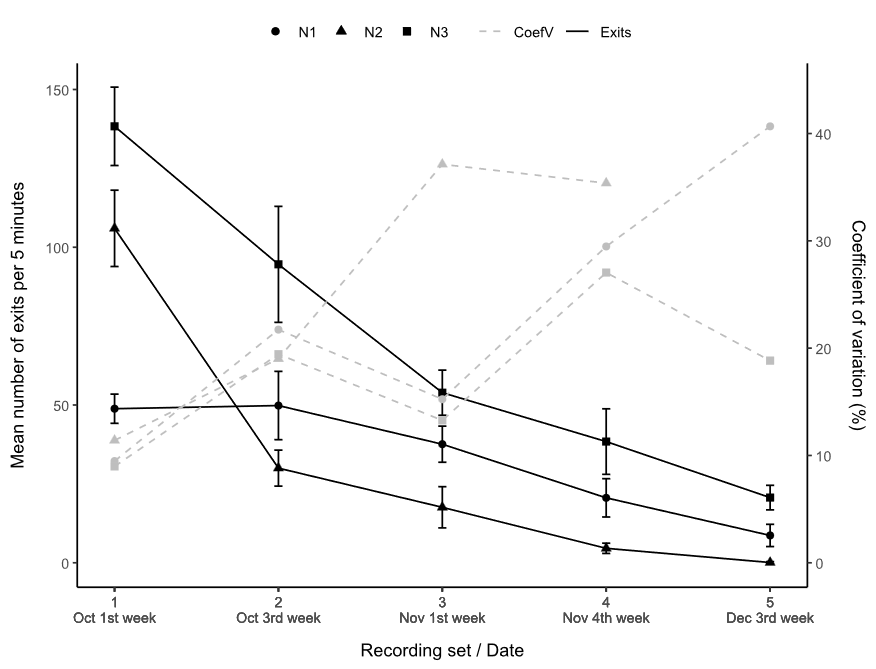
Relation between nests exits (Exits) (black continuous line) and coefficient of variation (CoefV) (grey dotted line) of the three nests studied N1 (●), N2 (▲), and N3 (■) grouped by recording sets. Error bars represent standard deviation of data (N=12)


Figure 5. Relation between nests exits (Exits) (black continuous line) and coefficient of variation (CoefV) (grey dotted line) of the three nests studied N1 (●), N2 (), and N3 () grouped by recording sets. Error bars represent standard deviation of data (N=12).

Figura 5. Relación entre las salidas del nido y el coeficiente de variación (CoefV) de los tres nidos estudiados (N1, N2 y N3) agrupados por grupos de grabación. Las barras de error representan la desviación estándar de los datos (N=12).

Discussion

Factors related to citizen reported nest data distribution

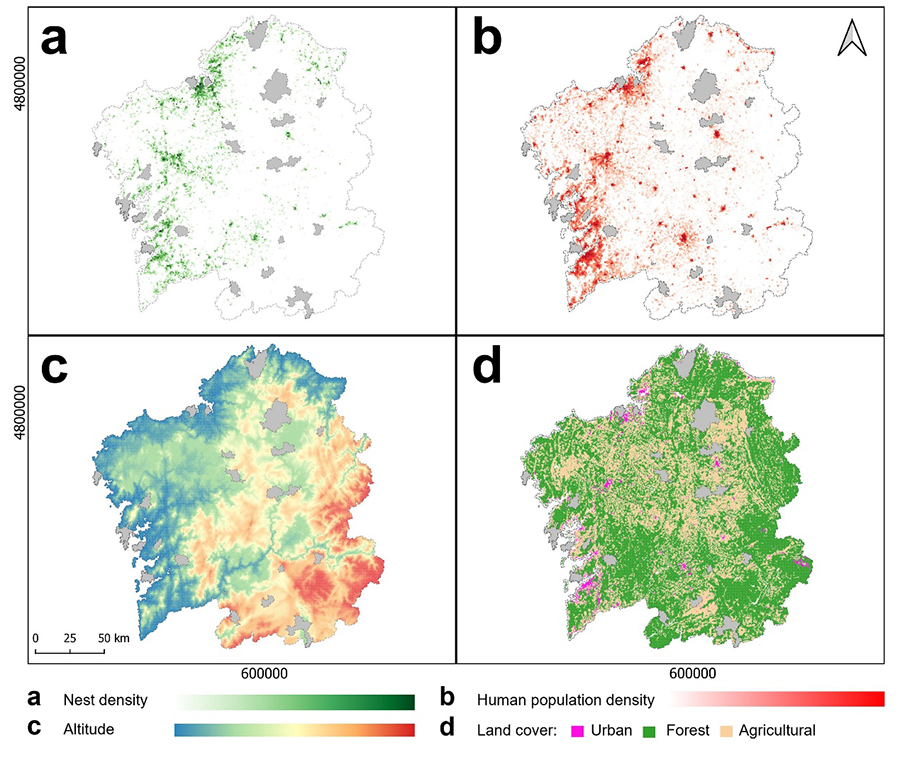
Human population density and urban land cover are the variables that best explain the likelihood of finding nests in Galicia. The most probable cause for this fact lies in the method of nest registration itself. The Xunta de Galicia's database consists of nest locations reported by citizens. In non-urban areas, the human population density is lower and consequently the number of observers, decreasing the likelihood of nests being discovered (Franklin et al. 2017). Moreover, nests in forested areas are more difficult to see as they are found in the treetops and camouflaged among the foliage (Rodríguez-Flores et al. 2019). Several studies (Villemant et al. 2011b; Choi et al. 2012b; Rodríguez-Flores et al. 2019) also suggest a greater preference by the hornet for urban environments. Thus, the high densities of nests found in urban areas are likely linked to both the number of observers and to the hornet's habitat preferences. Moreover, agricultural land cover favours nest observations, but its influence is almost four times lower than that of urban areas (Supplementary Information Tabla A1) probably due to the lower human population density and the nesting placement. Nests in cities receive more attention from the public, even the smallest ones are reported, whereas reports of harmless nests in rural areas are less likely to occur (Choi et al. 2019). In addition, city dwellers encounter nests closer to their homes, leading to an increased perception of risk, also fostered by the media (Do et al. 2019). In this context, Pazos et al. (2022) found that although people in Galicia report notifying authorities about the presence of nests for management purposes, the removal services report that most of the calls are justified by alleged allergies to the species or health concerns. This suggests a higher demand for the removal of nearby nests driven by fear of the species.

Altitude is also a good indicator of the likelihood of a nest being discovered, with higher altitudes decreasing the odds of nest encounters. This may be explained by the species expanding rapidly through coastal areas and preferring to nest in mild climates at low altitudes (Rodríguez-Flores et al. 2019). Nests are often found under 800 meters above sea level (Archer 2006) despite that they can be present at altitudes as high as 1100 meters above sea level (Porporato et al. 2014). In turn, human populations in Galicia are concentrated in coastal areas or associated with large cities and transport routes (IGE 2022). Therefore, increasing altitude decreases both the probability that a nest is present and reported by an observer.

The large number of nest reports indicates the wide distribution of the species in Galicia and the commitment of the community. The latter is crucial to help administrations manage the invasion effectively; however, many people are still misinformed, in part due to sensationalism or fake news (Pazos et al. 2022). The implementation of public information programmes on the management of the species would improve cooperation between citizens and authorities and optimise the resources allocated to the species control, saving costs and time.

Comparison of reported nest densities with those found by means of radio-tracking in a coniferous forest

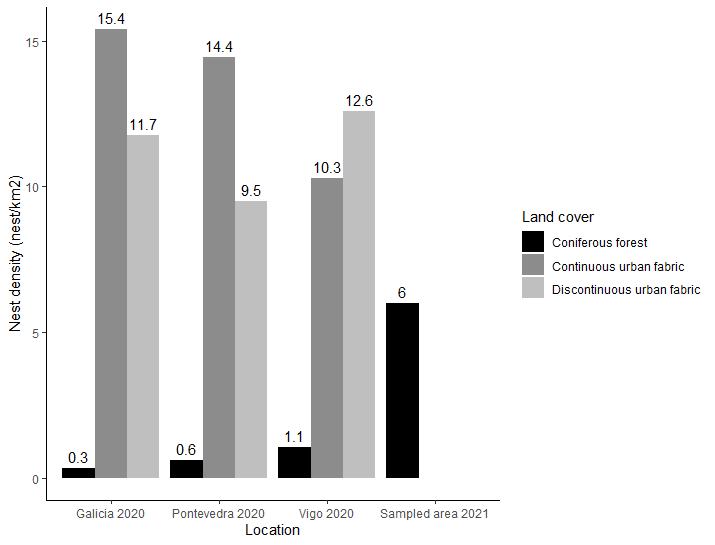
According to the Xunta de Galicia database, nest density in the municipality of Vigo in 2020 was 10 to 12 times higher in the urban environment (~11 nests/ km2) compared to coniferous forest (~1 nest/ km2). In France, Villemant et al. (2011b) reported that 49 % of the nests found were in the urban environment, while only 7 % in forest, resulting in 7-fold higher density in urban than forest environments. In the community of Andernos-les-Bains (France) almost all reported nests were found in the urban area with a density of 10 nests/km2 (Franklin et al. 2017). Closer to Galicia, in Portugal, Carvalho et al. (2020) found a lower nest density in the urban environment of 5.4 ±3.3 nests/km2.

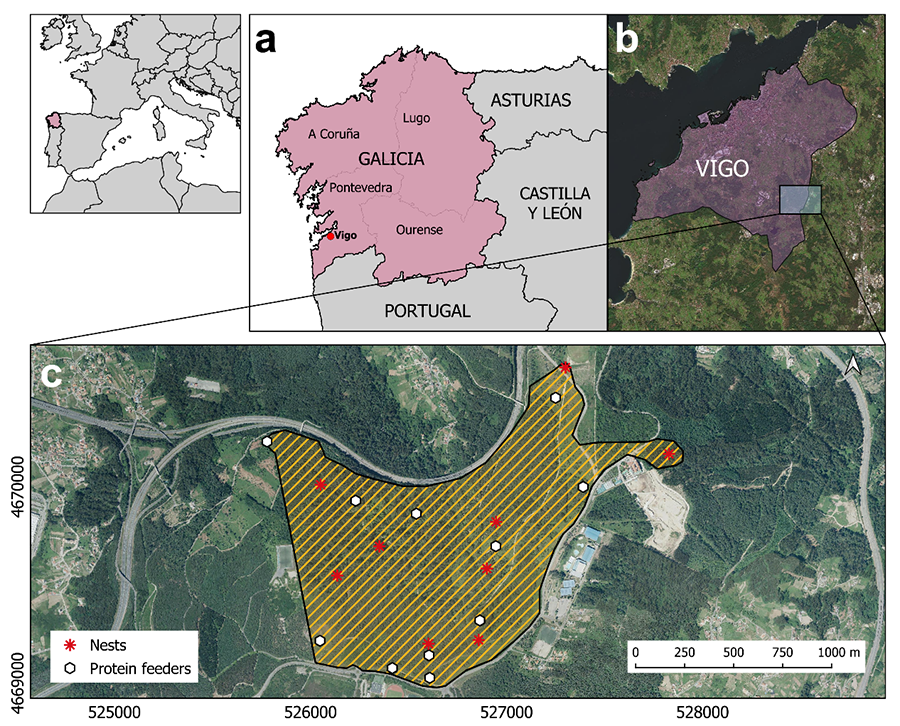
The results obtained in this study from an exhaustive radio-tracking search conducted in the summer of 2021 on outskirts of Vigo showed a nest density in the coniferous forest of 6 nests/km2. This is more than five times the density reported in the official data for the municipality of Vigo in coniferous forests. However, the sampling probably did not detect all the nests in the radio-tracked area. Using the method based on directions and timings (Rojas-Nossa et al. 2022) we can estimate that the actual number of nests was greater than that determined by radio-tracking in the summer of 2021. Thus, it can be concluded that the Xunta de Galicia database may be greatly underestimating nest density in coniferous forests.  This pattern can probably be explained by the scarcity of observers in forest areas and the fact that perennial coniferous forests increase the likelihood of not finding a nest even in autumn compared to deciduous forests (Bessa et al. 2016). These hypotheses are supported by the fact that no nests were reported the previous year in the sampled area.

The reported density of nests in the coniferous forest was higher in Vigo than in the province of Pontevedra, which in turn was higher than that for Galicia overall. This can be explained by reported nest density being influenced by human population density. The human population density of Vigo is higher than that of Pontevedra, which in turn is higher than that for Galicia overall. In addition, the nesting preference for coastal areas, the continental climate of inland Galicia, topography (especially mountains) or the different stages of the invasion may also contribute to this distribution pattern (Robinet et al. 2017; Rodríguez-Flores et al. 2019; Carvalho et al. 2020).

The high abundance of nests in forested areas makes us hypothesise that it could act as a source for the species. In this way, the higher number of queens caught in forests during spring found by Rojas-Nossa et al. (2018) supports this hypothesis. Management measures generally focus on urban environments, trying to reduce hornet densities, but nearby forests can contribute to increasing it in urban centres. Although the dispersion ability of queens is poorly documented, Beggs et al. (2011) reported that queens can fly about 30 km in 1 day, making the colonisation of urban areas and nest installation from nearby forests plausible. In addition, V. velutina workers may appear in cities because they can forage at distances of up to 1 km from the nest (Poidatz et al. 2018; personal observation AL). However, the management of the invasion in these areas is not easy due to the absence of observers and the fact that nests are hidden in the trees (Bessa et al. 2016). In this way, the management of forests near cities must be considered by the administrations to reduce the impact of the invasion in the cities. 

In addition, Vigo is the largest city in Galicia, containing extensive areas of continuous urban fabric far from green areas. Nest density in the municipality is greater in discontinuous urban areas than in continuous ones. The presence of green zones interspersed in the urban environment could favour the establishment of the species. These areas contain higher biodiversity, and hornets have a greater number of potential food sources and nesting sites, which can be limiting in the continuous urban fabric (Choi et al. 2012a).

Monitoring nests activities

The three nests monitored in the study reduces their activities during the late season; however different behaviours were observed. Both nests 2 and 3 demonstrated a sudden drop in activity between the first two recording sets 
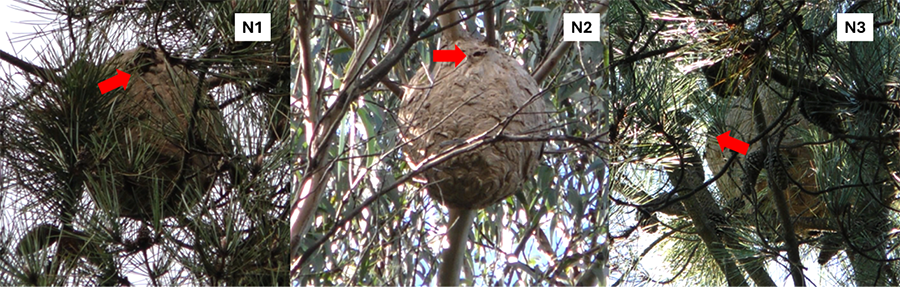
being more accused in nest 2. This may be because it was located at a height of 45 metres and quite far from the tree trunk. These characteristics suggest that weather factors (mainly rain and wind) could exert greater pressure on the nest because it was unprotected (Matsuura and Yamane 1990). Such a location also favours greater exposure to the sun, which can increase the nest temperature and negatively influence the colony (Rodríguez-Flores et al. 2019). The decrease in activity was persistent as it was the only nest that collapsed during the recording period showing clear signs of deterioration (changes in colour and damage to the outer nest structure; personal observations AL).

Otherwise, the population of V. velutina nests is closely related to the size of the nest (Rome et al. 2015). This may explain the higher activity of nest 3, as it was visually the largest of the three nests and the lower activity observed in nest 1. The abundant vegetation and the location close to the tree trunk protect V. velutina nests from the increasingly intense environmental factors as the season progressed too.

The proximity of the three nests to each other (at a maximum distance of 470 meters from one another) excludes the possibility that the differences observed in activity are due to climate or altitude. The results confirm the influence of the recording date on the activity of the nests, which collapsed later in January. This is in line with the life cycle of the species, in which all individuals (except hibernating gynes) die with the onset of winter (Monceau et al. 2014). Activity results are similar to those found in previous work in southwestern France (Rome et al. 2015; Monceau et al. 2017). The maximum levels of activity in these studies occurred in mid/late October, coinciding with the activity shown by nest 1. In nests 2 and 3 this peak of activity occurs at the beginning of the recording period, in late September and early October or even earlier. The higher variability observed in nest activities make us consider that the location of the nest is crucial for the evolution of hornet’s activity. Protected nests seem to be bigger and more active than unprotected ones. Also important, is the location of embryo nests as they are more vulnerable to the climatic factors (Diéguez-Antón et al. 2022) and may influence the future development of the secondary nest. Nest activities were confirmed in late autumn and even in early winter. Related to this, Feás Sánchez and Charles (2019) support that it is extremely important to remove V. velutina nests during the winter as well as the rest of the year.

To estimate nest activity, the observation time of 5 minutes proposed by Monceau et al. (2017) seems adequate up to the first recording set in this study. However, with reduced nest activity, the coefficient of variation between recordings increases to around 30 % by the final recordings, exceeding it in some cases, such that the confidence level with 5-minute recordings becomes insufficient (Gordón-Mendoza and Camargo-Buitrago 2015). Consequently, it is desirable to increase the recording time for activity at nests late in the season to obtain a higher level of confidence (coefficient of variation < 30 %). It is important to note that in addition to recording time, the day and time of sampling should be considered when comparing activities, as these factors also determine nest activity (Williams 1988). In this study, recordings were made only on sunny days and at midday to observe the peak daily activity. Consequently, understanding the temporal dynamics of nest collapse allows extending nest removal operations further into the late season, potentially reducing the spread of the invasion. However, since not all nests follow the same activity patterns, the monitoring of nest exits for a duration exceeding five minutes under favourable weather conditions can help identify inactive nests and avoid unnecessary removal efforts and associated costs.

These data are a first effort to establish decision criteria for nest removal at the end of the species' annual cycle. Although the sample size in our study is limited, the observed trends are similar to those reported in southern France (Monceau et al. 2017). Improving decision capacities contribute to reduce the economic costs of the invasion management. In this way, the total budget to manage the invasion overcame € 2 million in the community of Galicia in the year 2020 (Xunta de Galicia 2020a) and beekeepers receive government aid to compensate for hornet losses up to € 700 000 more (Xunta de Galicia 2020b). Moreover, detrimental effects on pollination services and behaviour of pollinators were demonstrated by Rojas-Nossa et al. (2022). In addition, the invasion entails human health costs due to hornet stings. All this data supports the urgency of acting against the invasion as it presented serious economic, ecosystemic and human health problems.

Conclusions

The official databases concerning V. velutina nests in Galicia are compiled using citizen reports. In this way, they do not offer a representative information of the distribution and abundance of the hornet in all the Galician territory. This study showed that citizen-reported data are mainly biased by the presence of observers and urban land use but may be related to other variables like altitude. In this way, nests located in urban areas are well represented in citizen reports which indicates that community engagement is effective in locating nests. However, nests in forestry land are underrepresented due to the near absence of observers and how hidden the nests are. Forests can act as a source for the species in the invaded area. Consequently, at the invasion front, greater search efforts in forest must be considered by the authorities to reduce the advance of the species.

To accurately assess nest activity, it is recommended to enhance the duration of time recording when a decline in activity is observed. Observations made in this study support extending efforts in nest removal into late autumn. This information can be useful to optimize resources for managing the V. velutina invasion and reduce socioeconomic and ecosystem impacts.

Author´s contribution

Aarón Lagoa: Conceptualization; Data curation; Formal Analysis; Investigation; Methodology; Visualization; Writing – Original Draft; Writing – Review & Editing. Iria Villar: Conceptualization; Data curation; Formal Analysis; Investigation; Methodology; Visualization; Writing – Original Draft; Writing – Review & Editing. Sandra V. Rojas-Nossa: Conceptualization; Formal Analysis; Investigation; Methodology; Visualization; Writing – Review & Editing. Peter J. Kennedy: Conceptualization; Data Curation; Investigation; Methodology; Visualization; Writing – Review & Editing. Salustiano Mato: Conceptualization; Supervision, Writing – Review & Editing. Josefina Garrido: Conceptualization; Funding Acquisition; Supervision; Writing – Review & Editing.

Data availability

The datasets used during the current study were provided on demand to the Regional Government of Galicia. More information could be required on reasonable request.

Financing, required permits, potential conflicts of interest and acknowledgments

This work was financed by the Interreg Atlantic Area Program (European Regional Development Fund—ERDF, European Union): EAPA_800/2018—Atlantic-Positive. The authors declare no conflicts of interest. Thanks to the Xunta de Galicia for providing the locations of the V. velutina nests, all anonymous people that reported nests in 2020 year and the reviewers of the paper for the suggestions that improved the article.

References

Archer, M.E. 2006. Taxonomy, distribution and nesting biology of species of the genus Dolichovespula (Hymenoptera, Vespidae). Entomological Science 9: 281-293. https://doi.org/10.1111/j.1479-8298.2006.00174.x

Barbet-Massin, M., Salles, J.-M., Courchamp, F. 2020. The economic cost of control of the invasive yellow-legged Asian hornet. NeoBiota 55: 11-25. https://doi.org/10.3897/neobiota.55.38550

Beggs, J.R., Brockerhoff, E.G., Corley, J.C., Kenis, M., Masciocchi, M., Muller, F., Rome, Q., et al. 2011. Ecological effects and management of invasive alien Vespidae. BioControl 56: 505-526. https://doi.org/10.1007/s10526-011-9389-z

Bessa, A.S., Carvalho, J., Gomes, A., Santarém, F. 2016. Climate and landuse drivers of invasion: predicting the expansion of Vespa velutina nigrithorax into the Iberian Peninsula Didham, R., Brady, S. (eds.). Insect Conservation and Diversity 9: 27-37. https://doi.org/10.1111/icad.12140

Carvalho, J., Hipólito, D., Santarém, F., Martins, R., Gomes, A., Carmo, P., Rodrigues, R., et al. 2020. Patterns of Vespa velutina invasion in Portugal using crowdsourced data. Insect Conservation and Diversity 13: 501-507. https://doi.org/10.1111/icad.12418

Castro, L., Pagola-Carte, S. 2010. Vespa velutina lepeletier, 1836 (Hymenoptera: Vespidae), recolectada en la Península Ibérica. Heteropterus Revista de Entomología 10: 193-196.

Choi, M., Kim, J., Lee, J. 2012a. Increase trend of social hymenoptera (wasps and honeybees) in urban areas, inferred from movingout case by 119 rescue services in Seoul of South Korea. Entomological Research 42: 308-319. https://doi.org/10.1111/j.1748-5967.2012.00472.x

Choi, M.B., Martin, S.J., Lee, J.W. 2012b. Distribution, spread, and impact of the invasive hornet Vespa velutina in South Korea. Journal of Asia-Pacific Entomology 15: 473-477. https://doi.org/10.1016/j.aspen.2011.11.004

Choi, M.B., Kim, T.G., Kwon, O. 2019. Recent Trends in Wasp Nest Removal and Hymenoptera Stings in South Korea. Journal of Medical Entomology 56: 254-260. https://doi.org/10.1093/jme/tjy144

Diéguez-Antón, A., Escuredo, O., Seijo, M.C., Rodríguez-Flores, M.S. 2022. Embryo, Relocation and Secondary Nests of the Invasive Species Vespa velutina in Galicia (NW Spain). Animals 12: 2781. https://doi.org/10.3390/ani12202781

Dillane, E., Hayden, R., O’Hanlon, A., Butler, F., Harrison, S. 2022. The first recorded occurrence of the Asian hornet (Vespa velutina) in Ireland, genetic evidence for a continued single invasion across Europe. Journal of Hymenoptera Research 93: 131-138. https://doi.org/10.3897/jhr.93.91209

Do, Y., Kim, J.B., Shim, J., Kim, C., Kwon, O., Choi, M.B. 2019. Quantitative analysis of research topics and public concern on V. velutina as invasive species in Asian and European countries. Entomological Research 49: 456-461. https://doi.org/10.1111/1748-5967.12390

Feás Sánchez, X., Charles, R.J. 2019. Notes on the nest architecture and colony composition in winter of the yellow-legged Asian hornet, Vespa velutina Lepeletier 1836 (Hym.: Vespidae), in its introduced habitat in Galicia (NW Spain). Insects 10(8), 237. https://doi.org/10.3390/insects10080237

Fick, S.E., Hijmans, R.J. 2017. WorldClim 2: new 1km spatial resolution climate surfaces for global land areas. International Journal of Climatology 37 (12):4302-4315. https://doi.org/10.1002/joc.5086

Franklin, D.N., Brown, M.A., Datta, S., Cuthbertson, A.G.S., Budge, G.E., Keeling, M.J. 2017. Invasion dynamics of Asian hornet, Vespa velutina (Hymenoptera: Vespidae): a case study of a commune in south-west France. Applied Entomology and Zoology 52: 221-229. https://doi.org/10.1007/s13355-016-0470-z

Gordón-Mendoza, R., Camargo-Buitrago, I. 2015. Selección de estadísticos para la estimación de la precisión experimental en ensayos de maíz. Agronomía Mesoamericana 26: 56-63. https://doi.org/10.15517/am.v26i1.16920

Grosso-Silva, J.M., Maia, M. 2012. Vespa velutina Lepeletier, 1836 (Hymenoptera, Vespidae), new species for Portugal. Arquivos entomolóxicos 53-54.

Hartig, F. 2016. DHARMa: residual diagnostics for hierarchical (multi-level/mixed) regression models. CRAN: Contributed Packages. https://doi.org/10.32614/CRAN.package.DHARMa.

IGE 2022. Distribución espacial de las características de la población de Galicia por cuadrícula de 1km2. Instituto Gallego de Estadística. Available at: https://www.ige.gal/igebdt/igeapi/csv/grid1km/2020/0/0/pob_total [Accesed 10 May 2022].

IGN 2022a. CORINE Land Cover 2018 (España) - CLC 2018 CC-BY 4.0. Centro Nacional de Información Geográfica (CNIG). Available at: https://www.idee.es/csw-inspire-idee/srv/spa/catalog.search?#/metadata/spaignCLC2018 [Accesed 10 May 2022].

IGN 2022b. Modelo Digital del Terreno de 2ª cobertura (2015-2021) con paso de malla de 200 metros (MDT200) de España - MDT200 2015 CC-BY 4.0. Centro Nacional de Información Geográfica (CNIG). Available at: https://centrodedescargas.cnig.es/CentroDescargas/mdt200-segunda-cobertura [Accesed 10 May 2022].

INE 2023. Cifras oficiales de población de los municipios españoles en aplicación de la Ley de Bases del Régimen Local (Art. 17). Available at: https://www.ine.es/jaxiT3/Datos.htm?t=2890 [Accesed 2 January 2023].

Kennedy, P.J., Ford, S.M., Poidatz, J., Thiéry, D., Osborne, J.L. 2018. Searching for nests of the invasive Asian hornet (Vespa velutina) using radio-telemetry. Communications Biology 1: 88. https://doi.org/10.1038/s42003-018-0092-9

Laurino, D., Lioy, S., Carisio, L., Manino, A., Porporato, M. 2019. Vespa velutina: An Alien Driver of Honey Bee Colony Losses. Diversity 12: 5. https://doi.org/10.3390/d12010005

Matsuura, M., Yamane, S. 1990. Biology of the vespine wasps. Springer-Verlag, Berlin, Heidelberg, Germany. https://doi.org/10.1007/978-3-642-75230-8

Monceau, K., Bonnard, O., Thiéry, D. 2014. Vespa velutina: a new invasive predator of honeybees in Europe. Journal of Pest Science 87: 1-16. https://doi.org/10.1007/s10340-013-0537-3

Monceau, K., Tourat, A., Arca, M., Bonnard, O., Arnold, G., Thiéry, D. 2017. Daily and Seasonal Extranidal Behaviour Variations in the Invasive Yellow-Legged Hornet, Vespa velutina Lepeletier (Hymenoptera: Vespidae). Journal of Insect Behavior 30: 220-230. https://doi.org/10.1007/s10905-017-9607-3

Pazos, T., Álvarez-Figueiró, P., Cortés-Vázquez, J.A., Jácome, M.A., Servia, M.J. 2022. Of Fears and Budgets: Strategies of Control in Vespa velutina Invasion and Lessons for Best Management Practices. Environmental Management 70: 605-617. https://doi.org/10.1007/s00267-022-01690-z

Perrard, A., Haxaire, J., Rortais, A., Villemant, C. 2009. Observations on the colony activity of the Asian hornet Vespa velutina Lepeletier 1836 (Hymenoptera: Vespidae: Vespinae) in France. Annales de la Société entomologique de France (N.S.) 45: 119-127. https://doi.org/10.1080/00379271.2009.10697595

Poidatz, J., Monceau, K., Bonnard, O., Thiéry, D. 2018. Activity rhythm and action range of workers of the invasive hornet predator of honeybees Vespa velutina, measured by radio frequency identification tags. Ecology and Evolution 8: 7588-7598. https://doi.org/10.1002/ece3.4182

Porporato, M., Manino, A., Laurino, D., Demichelis, S. 2014. Vespa velutina Lepeletier (Hymenoptera Vespidae): a first assessment two years after its arrival in Italy. Redia 97: 189-194.

R Core Team 2022. R: A language and environment for statistical computing. R Foundation for Statistical Computing, Vienna, Austria. https://www.R-project.org/

Robinet, C., Suppo, C., Darrouzet, E. 2017. Rapid spread of the invasive yellowlegged hornet in F rance: the role of humanmediated dispersal and the effects of control measures Diekötter, T. (ed.). Journal of Applied Ecology 54: 205-215. https://doi.org/10.1111/1365-2664.12724

Rodríguez-Flores, M.S., Seijo-Rodríguez, A., Escuredo, O., Seijo-Coello, M.D.C. 2019. Spreading of Vespa velutina in northwestern Spain: influence of elevation and meteorological factors and effect of bait trapping on target and non-target living organisms. Journal of Pest Science 92: 557-565. https://doi.org/10.1007/s10340-018-1042-5

Rojas-Nossa, S.V., Novoa, N., Serrano, A., Calviño-Cancela, M. 2018. Performance of baited traps used as control tools for the invasive hornet Vespa velutina and their impact on non-target insects. Apidologie 49: 872-885. https://doi.org/10.1007/s13592-018-0612-0

Rojas-Nossa, S.V., Gil, N., Mato, S., Garrido, J. 2021. Vespa velutina: traits and impacts of a successful invasive alien species. Ecosistemas 30: 1-10. https://doi.org/10.7818/ECOS.2159

Rojas-Nossa, S.V., Álvarez, P., Garrido, J., Calviño-Cancela, M. 2022. Method for Nest Detection of the Yellow-Legged Hornet in High Density Areas. Frontiers in Insect Science 2: 851010. https://doi.org/10.3389/finsc.2022.851010

Rome, Q., Muller, F.J., TouretAlby, A., Darrouzet, E., Perrard, A., Villemant, C. 2015. Caste differentiation and seasonal changes in Vespa velutina (Hym.: Vespidae) colonies in its introduced range. Journal of Applied Entomology 139: 771-782. https://doi.org/10.1111/jen.12210

Rome, Q., Perrard, A., Muller, F., Fontaine, C., Quilès, A., Zuccon, D., Villemant, C. 2021. Not just honeybees: predatory habits of Vespa velutina (Hymenoptera: Vespidae) in France. Annales de la Société entomologique de France (N.S.) 57: 1-11. https://doi.org/10.1080/00379271.2020.1867005

Venables, W.N., Ripley, B.D. 2002. Random and Mixed Effects. In Modern Applied Statistics with S, Statistics and Computing, pp. 271-300. Springer New York, NY, USA. https://doi.org/10.1007/978-0-387-21706-2_10

Villemant, C., Barbet-Massin, M., Perrard, A., Muller, F., Gargominy, O., Jiguet, F., Rome, Q. 2011a. Predicting the invasion risk by the alien bee-hawking Yellow-legged hornet Vespa velutina nigrithorax across Europe and other continents with niche models. Biological Conservation 144: 2142-2150. https://doi.org/10.1016/j.biocon.2011.04.009

Villemant, C., Muller, F., Haubois, S., Perrard, A., Darrouzet, E., Rome, Q. 2011b. Bilan des travaux (MNHN et IRBI) sur l’invasion en France de Vespa velutina, le frelon asiatique prédateur d’abeilles. Proceedings of the Journée Scientifique Apicole–11 February 3-12.

Williams, P. 1988. Social wasps (Hym., Vespidae) from the Kashmir Himalaya. Entomologist's Monthly Magazine, 124(1488–1491):149–152.

Wood, S.N. 2017. Generalized Additive Models: An Introduction with R (2nd edition). Chapman and Hall/CRC, New York.

Xunta de Galicia 2020a. RESOLUCIÓN de 16 de enero de 2020, de la Secretaría General Técnica de la Consellería de Presidencia, Administraciones Públicas y Justicia, por la que se da publicidad al encargo a la Empresa Pública de Servicios Agrarios Gallegos, S.A. (Seaga) para la tramitación y ejecución de los trabajos de retirada y destrucción de nidos incluidos en el Programa gallego de vigilancia y control frente a la avispa asiática (avispa velutina). Avaliable at: https://www.xunta.gal/dog/Publicados/2020/20200117/AnuncioG0244-160120-0003_es.html  [Accesed 5 May 2023].

Xunta de Galicia 2020b. RESOLUCIÓN de 16 de septiembre de 2020 por la que se da publicidad de las personas beneficiarias de las ayudas concedidas al amparo de la Orden de 20 de mayo de 2020 por la que se establece el régimen de ayudas a la apicultura y se convocan para el año 2020. Avaliable at: https://www.xunta.gal/dog/Publicados/2020/20200925/AnuncioG0426-170920-0002_es.html [Accesed 5 May 2023].

Zeileis, A., Kleiber, C., Jackman, S. 2008. Regression Models for Count Data. R. Journal of Statistical Software 27: 1-25. https://doi.org/10.18637/jss.v027.i08


Appendix / Anexo

Table A1. Exponentiated Coefficients from the Zero-Inflated Model.

Tabla A1. Coeficientes exponenciales del modelo cero inflado.


Variable

Count Component

Zero-Inflation Component

Intercept

23.117

16.458

Population (Nº people)

10.001

0.9459

Altitude (m)

0.9969

10.020

Agricultural land cover (Cell %) 

28.402

0.5157

Urban land cover (Cell %) 

97.332

0.2835