ecosistemas
ISSN 1697-2473
Open access / CC BY-NC 4.0
© 2024 The authors [ECOSISTEMAS is not responsible for the misuse of copyrighted material] / © 2024 Los autores [ECOSISTEMAS no se hace responsable del uso indebido de material sujeto a derecho de autor]
Ecosistemas 33(3): 2834 [September - December / septiembre - diciembre, 2024]: https://doi.org/10.7818/ECOS.2834
Associate editor / Editor asociado: Jorge Garrido-Bautista
RESEARCH ARTICLE / ARTÍCULO DE INVESTIGACIÓN
Plant phenotypes as trajectories: 38-yr monitoring reveals that shape of lifetime fecundity schedule is under selection in a Mediterranean shrub
Carlos M. Herrera1,* ![]()
(1) Estación Biológica de Doñana, Consejo Superior de Investigaciones Científicas (CSIC), Américo Vespucio 26, E-41092 Sevilla, Spain.
* Corresponding author / Autor para correspondencia: Carlos M. Herrera [herrera@ebd.csic.es]
|
> Received / Recibido: 18/08/2024 – Accepted / Aceptado: 10/11/2024 |
How to cite / Cómo citar: Herrera, C.M. 2024. Plant phenotypes as trajectories: 38-yr monitoring reveals that shape of lifetime fecundity schedule is under selection in a Mediterranean shrub. Ecosistemas 33(3): 2834. https://doi.org/10.7818/ECOS.2834
|
Plant phenotypes as trajectories: 38-yr monitoring reveals that shape of lifetime fecundity schedule is under selection in a Mediterranean shrub Abstract: Defining a phenotype is sometimes problematic in the case of modularly-built, nonunitary organisms with indeterminate growth dependent on environmental conditions, such as plants. This paper presents a proof of concept of the evolutionary significance of considering lifetime trajectories of individual plants as a component of their phenotypes. Plant size and inflorescence production were monitored for the whole reproductive lifespans of N = 128 individuals of the Mediterranean woody shrub Lavandula latifolia (Lamiaceae) over a 38-year period to address the following questions: Did individuals vary in lifetime trajectories of size and fecundity? and were parameters describing individual trajectories significant predictors of cumulative lifetime reproduction? Individuals differed widely in lifetime fecundity and in every parameter describing lifetime fecundity schedule (age at first and last reproduction, longevity, and mean, variance, skewness and kurtosis of lifetime temporal distribution of inflorescence production). Phenotypic selection analysis revealed significant relationships between parameters of individual lifetime schedules and a surrogate of relative fitness of individuals (cumulative lifetime production of inflorescences divided by the average for all individuals). Significant selection gradients involved positive and negative directional selection, as well as instances of nonlinear selection, which showed that plants with certain shapes of lifetime fecundity schedules had fitness advantage over others. The notion of plant phenotypes as trajectories was strongly supported by the combined findings that individuals differed greatly in their "appearances" regarding the way in which size and fecundity unfolded over lifetime, and that selection efficaciously "saw" such variation. Keywords: demography; individual variation; Lavandula latifolia; life history; lifetime fecundity schedule; plant phenotype; plant senescence; phenotypic selectionl El fenotipo de las plantas como una trayectoria: seguimiento de 38 años revela que la historia vital de fecundidad está bajo selección en un arbusto mediterráneo Resumen: La definición de un fenotipo resulta a veces problemática para organismos no unitarios de estructura modular y crecimiento indeterminado, como son las plantas. Este artículo presenta una prueba de concepto de la importancia evolutiva de considerar las trayectorias de vida de plantas individuales como un elemento de sus fenotipos. Durante un período de 38 años se registró el tamaño de la planta y la producción de inflorescencias durante toda la vida reproductiva de N = 128 individuos del arbusto leñoso mediterráneo Lavandula latifolia (Lamiaceae) para abordar las siguientes preguntas: ¿Existieron diferencias entre individuos en sus trayectorias vitales de tamaño y fecundidad?, ¿Los parámetros que describen las trayectorias individuales estuvieron relacionados con la reproducción acumulada durante la vida? Los individuos difirieron ampliamente en fecundidad acumulada a lo largo de la vida y en cada uno de los parámetros empleados para describir el cronograma de fecundidad a lo largo de la vida (edad en la primera y última reproducción, longevidad, y la media, varianza, asimetría y curtosis de la distribución temporal de la producción de inflorescencias a lo largo de la vida). El análisis de selección fenotípica reveló relaciones significativas entre los parámetros que describen los programas de vida individuales y la estima empleada para describir la aptitud relativa de los individuos (producción acumulada de inflorescencias durante toda la vida dividida por el promedio de todos los individuos). Los gradientes de selección obtenidos demostraron la existencia de selección direccional positiva y negativa, así como casos de selección no lineal sobre algunas variables. Ello vino a demostrar que plantas cuyas curvas de fecundidad durante la vida poseen ciertas formas tenían una ventaja de aptitud sobre las otras. Estos resultados apoyan la idea de que la forma de las trayectorias vitales de las plantas individuales conforma parte de sus fenotipos. Palabras clave: demografía; fenotipo de plantas; historia vital; Lavandula latifolia; selección fenotípica; senescencia de plantas; trayectoria vital de fecundidad; variación individual |
Introduction
Defining the phenotype of an organism is central to understanding the links between selection and potential evolutionary change, and how selection "sees" and "filters out" the variants of individual appearance that commonly coexist in natural populations of the same species. As stressed by Lewontin (1974, p. 19), "it is the evolution of the phenotype that interests us … [because] … what are ultimately to be explained are the myriad and subtle changes in size, shape, behavior, and interactions with other species that constitute the real stuff of evolution". Selecting discrete or continuous measurable traits of individuals for obtaining a representation of their appearance is a trivial matter when one deals with unitary, non-modularly built organism with determinate growth such as most animals, but it is somewhat problematic in the case of modularly-built, nonunitary organisms with indeterminate growth such as most plants (Chitwood and Topp 2015; Herrera 2024a). For example, defining the leaf or seed phenotype of an individual plant which can bear up to thousands of nonidentical copies of each of these kinds of homologous, reiterated structures poses a conceptual challenge, and it has been proposed that intraplant distribution in quantitative traits of reiterated structures should be considered a relevant dimension of its phenotype or appearance (Herrera 2024a).
One additional, insufficiently recognized difficulty to define plant phenotypes is that single-value traits of individuals (e.g. plant size), or features of the subindividually variable organs (e.g. leaf traits), can vary in the short term or over a plant's lifetime due to ontogenetic processes (Herrera 2009; Kulbaba et al. 2017; Steppe et al. 2011; Harder et al. 2019). In organisms with long life cycles such as perennial plants phenotypic traits will change with age, and development can be highly variable among individuals (Coleman et al. 1994; Chitwood and Topp 2015). This points to the need of incorporating a temporal dimension into the description of individual plant phenotypes for those traits that experience discernible ontogenetic changes over the plant's lifetime (e.g. size, chemical, structural and functional traits of single leaves; Goodger et al. 2006; Greenwood et al. 2008; Steppe et al. 2011; Ji et al. 2021). Whenever individuals in a plant population differ in the properties of their lifetime trajectories for a given phenotypic trait, the shape of the trajectory will in itself be an element of the phenotype (my usage here of "phenotypes as trajectories" bears no relationship to the concept of "phenotypic trajectories" used to depict evolutionary changes of species or populations in phenotypic space; Adams and Collyer 2009; Billman et al. 2014).
This paper presents a proof of concept of the evolutionary significance of considering lifetime trajectories as part of individual plants' phenotypes. The study is based on data obtained by monitoring the growth and reproduction of a large sample of individuals of the Mediterranean woody shrub Lavandula latifolia (Lamiaceae) over their whole reproductive lifespans. The shape of lifetime reproductive schedule is taken here as a particular instance of phenotypic trajectory. The following specific questions will be addressed: (1) Did L. latifolia individuals differ substantially with regard to descriptive parameters of their lifetime size and fecundity trajectories, so that it makes sense to incorporate such trajectories into the description of their phenotypes?; and (2) If individual differences in lifetime trajectory did exist, were descriptive parameters of individual trajectories significant predictors of cumulative lifetime reproduction, so that the existence of phenotypic selection on lifetime fecundity schedules can be inferred? Results will provide affirmative answers to these two questions by showing that, when monitored over their entire reproductive lifetimes, individuals varied widely in size and fecundity trajectories, and that such variation was related to differential lifetime fecundity. Although some results presented here are also relevant in the light of plant demography and life history evolution (see Discussion), most of these aspects will not be considered in detail, as the main purpose of this article is to highlight the conceptual significance of considering the shape of lifetime trajectories as a phenotypic component in long-lived plants.
Materials and methods
Study plant
Lavandula latifolia is an evergreen shrub inhabiting forest clearings and edges in mid-elevation woodlands of the eastern and southeastern Iberian Peninsula (see Fig. A1 in Appendix A of Herrera and Jovani 2010, and Fig. 1 in Alonso et al. 2018, for photographs). Flowering lasts from July to October and flowers are pollinated by a diverse assemblage of bees, butterflies and flies. The flowers are self-compatible, but spontaneous autogamy occurs rarely due to protandry and, principally, to the spatial separation of anthers and stigma. In the absence of pollinators, a negligible proportion of flowers set fruit. Outcross pollination results in greater proportion of flowers setting fruit, and greater proportion of ovules yielding seeds per fruit, relative to self-pollination. The species reproduces exclusively by seeds, which are small (~1 mg) and lack special mechanisms for dispersal, falling passively to the ground after maturation.
Plants have a main taproot and a short (usually <15 cm) main woody stem and can be accurately aged by counting growth rings. Branching is dichasial, generally conforming to Leeuwenberg's development model (a sympodial succession of equivalent sympodial units, each of which is orthotropic and determinate in its growth; Hallé et al. 1978; Hallé 1986). This branching pattern leads to crowns of adult plants being made up of distinct leaf clusters borne by short stems, many of which produce one terminal inflorescence in early summer. Each of these leaf clusters represents a "module" according to Hallé's (1986, p. 78) definition ("the leafy axis in which the entire sequence of aerial differentiation is carried out, from the initiation of the meristem that builds up the axis to the sexual differentiation of its apex"). This produces an architecturally-mediated relationship between the number of inflorescences produced by an individual shrub at a given season and the total number of actively growing modules, as well as a close correlation between current leaf biomass and annual inflorescence production by individual plants. In the population studied, yearly seed production by adult plants was predicted by the number of inflorescences (R2 = 0.44, Herrera 1991), and individual variation in average per-seed viability (emergence rate and seedling survival) was comparatively narrow in relation to the broad differences in inflorescence production (Herrera 2000). Annual inflorescence production can therefore be used as a reasonable proxy for fecundity comparisons both across individuals and across years within individuals. Further details on natural history, reproductive biology and demography of L. latifolia in the study area can be found in Herrera (1987, 1991, 2001), Herrera and Jovani (2010), Herrera and Bazaga (2016), Alonso et al. (2018) and Herrera et al. (2021).
Field methods
This study was conducted during 1986-2023 at the "Aguaderillos-2" site of Herrera (1988, 1991), located at 1220 m elevation in a mixed woodland of Pinus nigra and Quercus rotundifolia in the Sierra de Cazorla, Jaén province, southeastern Spain (site coordinates 37.9612ºN, 2.8847ºW). A permanent 200-m2 plot was established there in July 1986 which remained undisturbed for the whole duration of this study. In August 1986 all L. latifolia plants within the plot bearing ≥10 leaves (roughly ≥ 2 yr in age) were mapped, tagged and measured (see below), and the number of current year's inflorescences counted. Only the subset of plants which at the time of tagging in 1986 were nonreproductive juveniles and reproduced in two or more years over 1987-2023 will be considered here (N = 128). I am confident that the data for these plants encompassed their complete reproductive lifespans because were still very small in 1986, none of them flowered in 1986 or bore remains of previous years' inflorescences (which can persist for 2-3 years), and all of them had already died by the summer of 2023. All plants were checked every summer (August-September) between 1987-2023. On each occasion, individuals found dead were digged up, collected, and their age at the time of death determined by ring counting. For each individual that remained alive, the number of inflorescences produced in the current year was counted and, on the even years, their size was assessed by measuring the two major axes of the canopy and then computing the area of the horizontal projection by assimilating the shape to an ellipse (in L. latifolia plant area is correlated with number of modules and total leaf biomass; C. M. Herrera, unpublished data). In senescent plants with discontinuous canopies comprising two or more living sectors (see photographs in Fig. A4, Appendix A of Herrera and Jovani 2010, for examples), measurements were taken and areas computed separately for each living sector, and then summed up to obtain a single size estimate for the individual.
Data analysis
The birth year of every monitored individual was determined by substracting the age at death from the year of death, and this information was then used to retrospectively compute the age of every plant in each study year. These data were then merged with those on yearly plant fecundity (number of inflorescences) and plant size measurements (estimated canopy area) to obtain individual lifetime profiles of size and fecundity in relation to current age.
The lifetime fecundity schedule of each plant was characterized quantitatively by combining two sets of parameters, hereafter named "landmark" and "shape" lifetime parameters. The landmark parameters refer to individual life history attributes from the classical "generalized triangular reproductive function" (Lewontin 1965; Harper 1977): age at first reproduction, age at last reproduction, and age at death ("total lifespan" hereafter). The shape parameters summarize numerically the individual trajectories by taking advantage of the fact that, when complete lifetime data are used, individual curves of yearly fecundity versus age actually represent frequency distributions of the age at which reproductive units (inflorescences in the present instance) were produced. The first four statistical moments of such frequency distributions (mean, variance, skewness, kurtosis) were computed for each plant and provided the shape parameters of lifetime fecundity schedules. The intensity of linear (directional, bi) and quadratic (stabilizing or disruptive, gi) selection gradients on lifetime fecundity schedules was investigated by adopting a phenotypic selection approach, based on regressing total inflorescences produced over individual lifetime against landmark and shape parameters and their quadratic transforms (Lande and Arnold 1983; Svensson 2023).
All statistical analyses reported in this paper were carried out using the R environment (R Core Team 2023). Average population-level trajectories of plant size and annual inflorescence production in relation to plant age were estimated by fitting random-slopes, random-intercepts linear mixed-effect models to plant area and inflorescence number data (both log-transformed), with age and age-squared as fixed-effect predictors and individual plant as random factor. The population average for the within-plant relationship over lifetime between plant size and inflorescence production was evaluated by fitting a random-slopes, random-intercepts linear mixed-effect model to the data with plant size as fixed-effect predictor and plant as random factor. The function lmer in the package lme4 (Bates et al. 2015) was used for fitting mixed-effect models, and predicted shapes of the relationships and associated confidence intervals were obtained by applying to each fitted model the function ggpredict from the ggeffects package (Lüdecke 2018). Marginal R2 (variance explained by fixed factors) and conditional R2 (variance explained by both fixed and random factors) of mixed-effect models (Nakagawa and Schielzeth 2013) were obtained with function r2_nakagawa in the performance package (Lüdecke et al. 2021).
Phenotypic selection on descriptive parameters of individual lifetime fecundity schedule was assessed by fitting a linear model to the data using function lm in the stats package. For the estimation of selection gradients (bi, gi) and their standard errors, the response variable was the cumulative production of inflorescences over each individual's lifetime divided by the average of this value for all individuals in the sample ("relative fitness", Lande and Arnold 1983). The predictors were the three landmark and four shape schedule parameters defined above plus their quadratic transforms, all of which were included simultaneously in a single multiple regression model. All variables in the model except the response were scaled to mean zero and standard deviation unity, so that the estimated model parameters represented standardized estimates (Lande and Arnold 1983). Nonlinear selection gradients (gi) were obtained by multiplying by two the partial regression coefficients of quadratic terms in the model (Stinchcombe et al. 2008). Individual lifetime fecundity departed substantially from normality, which invalidated asymptotical statistical significance tests of parameters based on their standard errors from this model. To evaluate the statistical significance of predictors, the model was re-run after transforming fecundity values logarithmically, which satisfactorily normalized residuals, and significance of parameter estimates (i.e., bi or gi ≠ 0) was then evaluated with ordinary F tests using the Anova function in the car package (Fox and Weisberg 2019).
Results
Population-level relationships between size, fecundity and age
After statistically accounting for individual heterogeneity by including plant as a random factor in the model, there existed a close linear relationship at the population level between yearly inflorescence production and current plant size (area alive) over an individual plant's lifetime (Fig. 1A; Chi-square = 316.14, df = 1, P < 1e-06). The model fit well the data, and the rough similarity between marginal (0.598) and conditional (0.788) R2 values suggests that individual variation in the size-fecundity relationship was only a secondary source of variance in yearly inflorescence production.
As would be anticipated from the close relationship between size and fecundity over individual plant lifetime, the model-estimated, population-level relationship linking plant size (Fig. 1B; marginal R2 = 0.353, conditional R2 = 0.852) and yearly inflorescence production (Fig. 1C; marginal R2 = 0.237, conditional R2 = 0.820) with plant age were virtually identical. On average, both size and yearly inflorescence production first increased steadily until plants reached ~15 years and then declined steadily until death. The substantial difference between marginal and conditional R2 in each of these two models provides an indirect indication that the among-plant differences subsumed into the random terms were substantial and contributed most variance to the response variables in the models, as detailed in the following section. Given the close similarity between lifetime patterns for size and inflorescence production, only the latter will be considered hereafter.
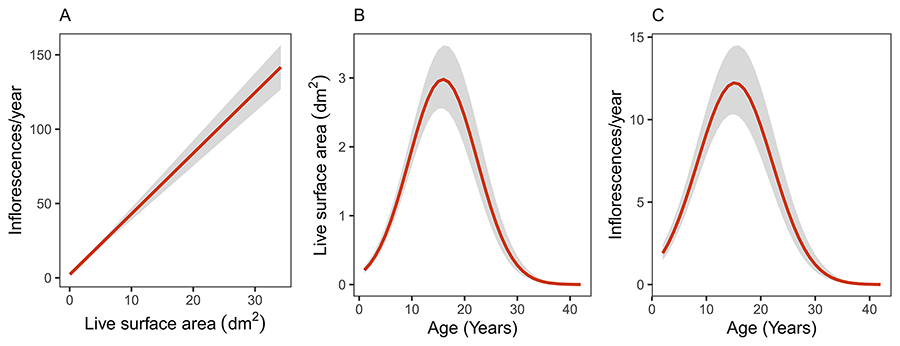
Figure 1. Model-predicted, average population-level estimates of the relationships linking current plant size with yearly inflorescence production (A), and plant age with size (B) and yearly inflorescence production (C), over the lifetime of individual plants. Predictions were obtained by fitting random-slopes, random-intercepts linear mixed-effect models to the data in which the variable on the vertical axis was the response variable, the variable on the horizontal axis was the fixed-effect predictor (the quadratic transform was also included in the case of B and C), and plant was included as random factor. In B and C the response variable was log-transformed for the analyses, and model predictions were back-transformed to the original scale of measurement. Grey areas represent standard errors around estimates.
Figura 1. Estimaciones medias para la población de las relaciones que vinculan el tamaño de la planta con la producción anual de inflorescencias (A), y la edad de la planta con el tamaño (B) y la producción anual de inflorescencias (C), a lo largo de la vida completa del individuo. Las predicciones se obtuvieron ajustando modelos lineales de efectos mixtos con pendientes e interceptos aleatorios en los que la variable del eje vertical era la variable respuesta, la variable del eje horizontal el predictor de efecto fijo (en el caso de B y C se incluyó también el término cuadrático) y la planta se incluyó como factor aleatorio. En B y C la variable respuesta se transformó logarítmicamente para los análisis y las predicciones del modelo se retrotransformaron a la escala original de medida. Las áreas grises representan los errores estándar en torno a las estimaciones.
Individual lifetime fecundity schedules and parameters
The lifetime reproductive schedules of individual L. latifolia plants are plotted side by side in Figure 2 to graphically highlight the extraordinary multivariate diversity of lifetime fecundity trajectories represented in the population studied. Individual schedules included, for example, broad-flat ones with slowly increasing production of inflorescences over all the reproductive lifespans; broad-weakly convex ones denoting long reproductive lifespans with a shallow peak at some intermediate age; or narrow-convex shapes with reproduction concentrated over short reproductive spans. Schedule diversity involved variation in age at first reproduction (range = 2-17 years, interquartile range IQR = 5-7), age at last reproduction (range = 6-42 years, IQR = 18-24), and total lifespan (range 10-44 years, IQR = 20-26). Across plants, age at first reproduction was not significantly correlated with either age at last reproduction or total lifespan (rs = 0.106 and 0.144, P = 0.23 and 0.11, respectively, N = 128, Spearman rank correlation). The extensive individual variation in shape of lifetime fecundity schedules (Fig. 2) was also reflected in the broad frequency distributions of the four shape parameters considered (Fig. 3).
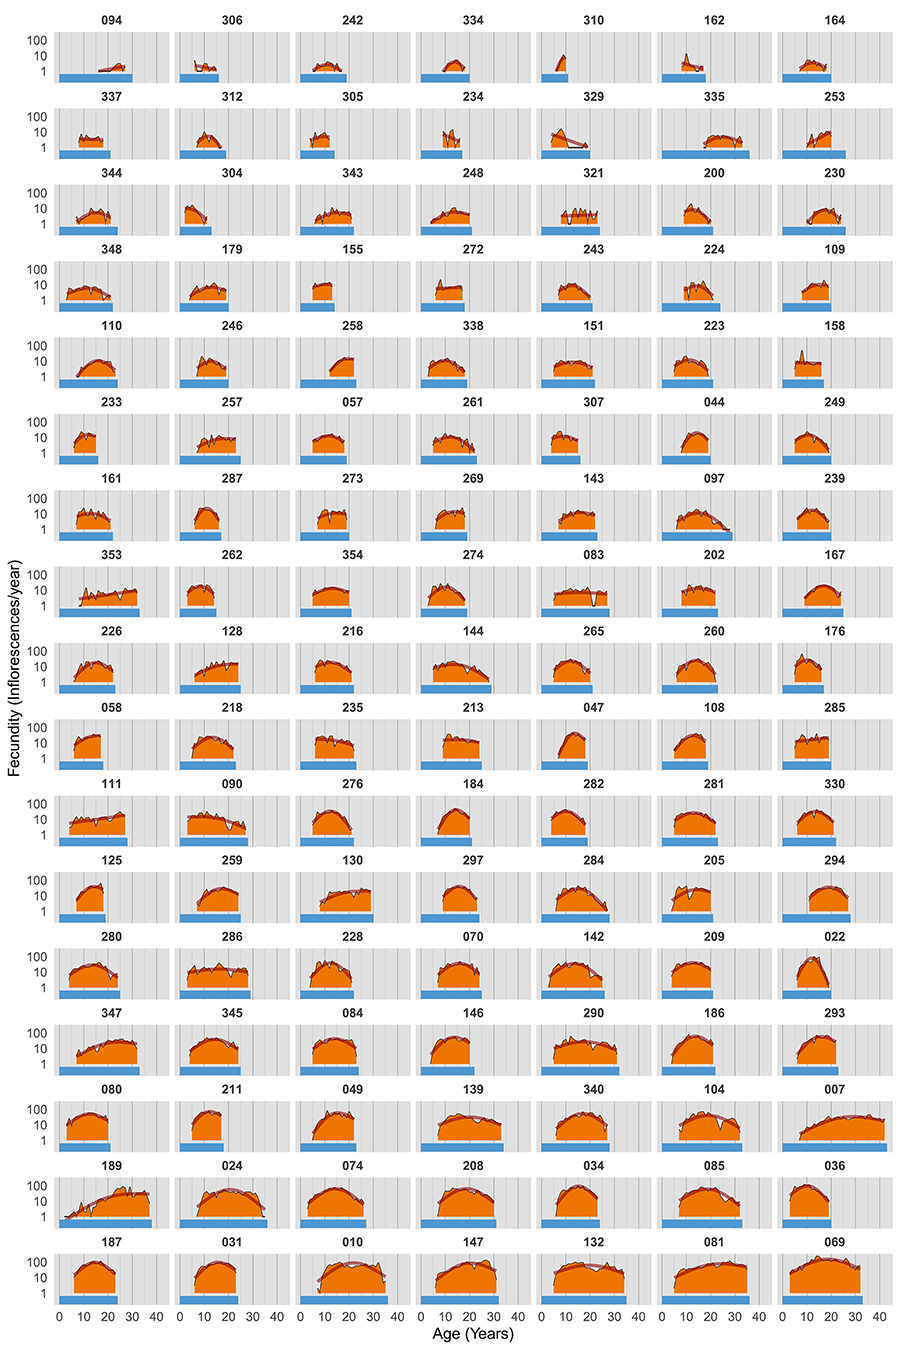
Figure 2. Lifetime reproductive schedules of individual Lavandula latifolia plants that were monitored for their whole reproductive lifespans. Nine plants that flowered on fewer than 4 years were excluded from the figure. Each panel corresponds to a different individual (identified by its field tag) and shows lifetime variation in yearly inflorescence production (orange-filled area under thin black lines), smoothed lifetime fecundity trajectory (thick orange line, fitted to yearly data using a gam smoother), and total lifespan (horizontal blue bar). Plants are ordered by increasing lifetime fecundity (orange area, from left to right, and top to bottom). Note logarithmic scale on vertical axis.
Figura 2. Pautas reproductivas a lo largo de la vida de plantas individuales de Lavandula latifolia que fueron seguidas durante su vida reproductiva completa. Se excluyeron de la figura nueve plantas que florecieron menos de 4 años. Cada panel corresponde a un individuo diferente (identificado por su etiqueta de campo) y muestra la variación de por vida en la producción anual de inflorescencias (área naranja bajo líneas negras finas), la trayectoria suavizada de fecundidad de por vida (línea naranja gruesa, ajustada a los datos anuales mediante un suavizador gam) y la duración de la vida (barra azul horizontal). Las plantas están ordenadas por fecundidad de por vida creciente (área naranja, de izquierda a derecha y de arriba a abajo). Nótese la escala logarítmica en el eje vertical.
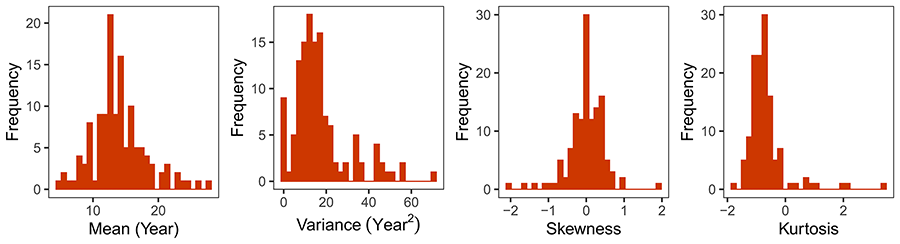
Figure 3. Frequency distributions of the four shape parameters describing individual lifetime fecundity curves in the set of Lavandula latifolia plants studied (N = 128). Shape parameters are the four moments of the frequency distributions of the ages at which lifetime inflorescences were produced by each plant (mean, variance, skewnes and kurtosis).
Figura 3. Distribuciones de frecuencias de los cuatro parámetros que describen la forma de las curvas de fecundidad individuales a lo largo de la vida para las plantas de Lavandula latifolia estudiadas (N = 128). Los parámetros son los cuatro primeros momentos de las distribuciones de frecuencias de la edad a la que se produjeron las inflorescencias a lo largo de la vida de cada planta (media, varianza, asimetría y curtosis).
The diversity of lifetime fecundity schedules represented in the set of monitored plants is well synthesized by the broad two-dimensional scatter of the empirical cumulative distributions of fecundity against age when data points for all individuals are plotted together (Fig. 4). The cumulative proportion of inflorescences produced up to a given age, or the age required to achieve a given proportion of cumulative lifetime fecundity, were both extremely variable among plants. For example, some individuals had already produced 50% of their eventual lifetime inflorescences before being 10 years old, while others only achieved that cumulative fecundity threshold at ages ≥20. At age 20 some plants had still produced less than 25% of lifetime inflorescences while many had already produced more than 75%.
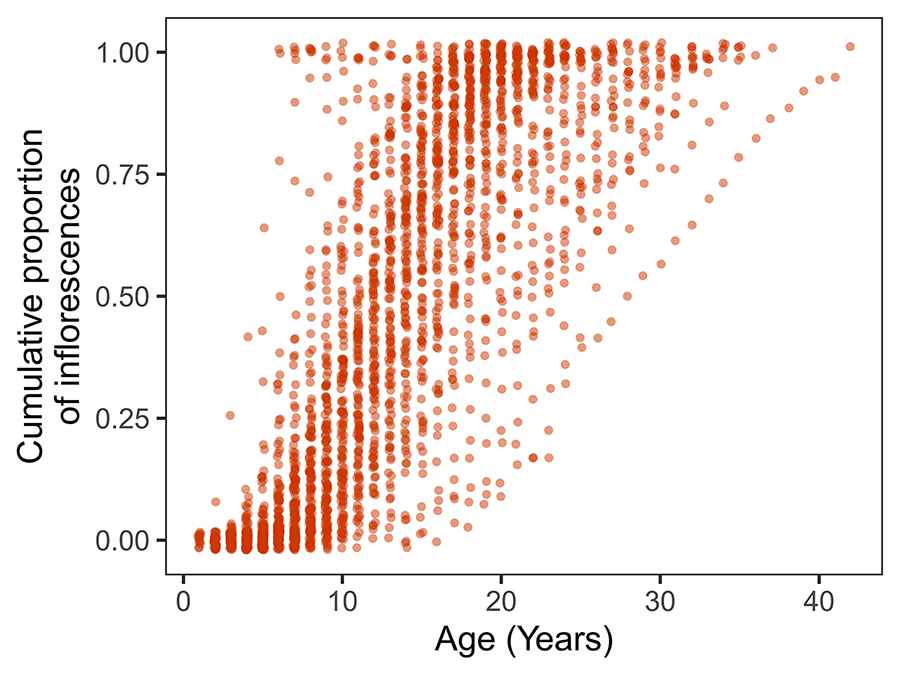
Figure 4. Cumulative density distributions of the number of inflorescences produced over lifetime by individual Lavandula latifolia plants. To avoid cluttering and highlight the broad individual variability represented in the sample of plants studied, lines connecting points for individual plants are omitted. For any given age, each point corresponds to a different plant, and the vertical scatter illustrates individual variation in the proportion of total lifetime inflorescences that were produced up to and including that age. A small random noise has been added to the horizontal and vertical coordinates of data points.
Figura 4. Distribuciones de densidad acumulada del número de inflorescencias producidas a lo largo de la vida por plantas individuales de Lavandula latifolia. Se omiten las líneas que conectan los puntos de cada planta para facilitar la interpretación y destacar la amplia variabilidad individual representada en el conjunto de las plantas estudiadas. Para una edad determinada, cada punto corresponde a una planta diferente y la dispersión vertical ilustra la variación individual en la proporción de inflorescencias totales a lo largo de la vida que se produjeron hasta esa edad inclusive. Se ha añadido un pequeño ruido aleatorio a las coordenadas horizontales y verticales de los datos.
Phenotypic selection on lifetime fecundity schedule
Individual plants differed widely in lifetime fecundity (range = 3‑2810 inflorescences, IQR = 86-406). After transformation to individual relative fitness, lifetime fecundity was significantly predicted by the landmark and shape parameters of lifetime fecundity schedules (F14, 113 = 30.6, P < 2.2e-06, adjusted R2 = 0.791; multiple regression of log-transformed relative fitness against standardized landmark and shape parameters). Each descriptive parameter of the fecundity schedule was a significant predictor of lifetime inflorescence production after statistically controlling for the combined effects of the rest of parameters (Table 1). In the case of landmark parameters only the linear terms had significant effects on lifetime fecundity: age at last reproduction was directly related to lifetime fecundity, while age at first reproduction and total lifespan were both inversely related. These relationships denote that plants starting to reproduce earlier in life, discontinuing reproduction at a later age, and/or having shorter longevities tended to be at relative fecundity advantage. In the case of shape parameters there were both linear and quadratic significant effects. Lifetime schedule curves with lower variance and kurtosis (i.e., narrower curves) were at relative fecundity advantage. Significant quadratic effects had either positive (variance, skewness) or negative (mean) signs (Table 1), revealing instances of stabilizing and disruptive selection, respectively.
Table 1. Standardized linear and quadratic selection gradients on the seven parameters used to describe the lifetime fecundity schedules of Lavandula latifolia plants studied (N = 128). Statistically significant terms (P < 0.05) are shown in bold type.
Tabla 1. Gradientes estandarizados de selección lineal y cuadrática sobre los siete parámetros utilizados para describir los cronogramas de fecundidad a lo largo de la vida de las plantas de Lavandula latifolia estudiadas (N = 128). Los términos estadísticamente significativos (P < 0.05) se muestran en negrita.
|
|
Terms in the model |
||||||
|
|
Linear |
|
Quadratic |
||||
|
Fecundity schedule parameters: |
bi |
SE |
P-value |
|
gi |
SE |
P-value |
|
Landmark parameters: |
|
|
|
|
|
|
|
|
Age at first reproduction |
-1.439 |
0.237 |
2.8E-08 |
|
+0.384 |
0.098 |
0.32 |
|
Age at last reproduction |
+1.442 |
0.994 |
4.2E-05 |
|
+1.696 |
0.728 |
0.50 |
|
Total lifespan |
-0.512 |
0.778 |
0.012 |
|
-0.506 |
0.740 |
0.53 |
|
Shape parameters: |
|
|
|
|
|
|
|
|
Mean |
+1.525 |
0.485 |
0.11 |
|
-1.330 |
0.252 |
0.024 |
|
Variance |
-1.661 |
0.469 |
5.5E-05 |
|
+0.502 |
0.196 |
0.0051 |
|
Skewness |
+0.216 |
0.149 |
0.78 |
|
+0.574 |
0.230 |
0.022 |
|
Kurtosis |
-0.582 |
0.226 |
0.0059 |
|
-0.058 |
0.096 |
0.18 |
Discussion
Population average versus individual lifetime schedules
Monitoring the whole reproductive lifespans of a large sample of L. latifolia plants of known birth date has revealed a well-defined average lifetime fecundity schedule at the population level. It involved a steep increase in size and reproduction up to reaching a peak about midway in lifetime (~15 years), followed by a steep decline ending up in the plant's death (~30-40 years). This two-stage lifetime pattern was parsimoniously accounted for by a shift in the dynamic balance between module formation and module death, in accordance with the notion of the plant individual as a population of semi-autonomous modules (White 1979; Watkinson and White 1985). During the first phase the number of living modules and inflorescences produced annually increased steadily with age, while a senescence period (meant here as age-dependent decline in size and reproduction) ensued during the second phase. In this period, inflorescence production declined and living area shrank because yearly production of new modules did not compensate for the increasing annual mortality of modules. The present results for L. latifolia (see also Herrera and Jovani 2010) contribute to the accumulating evidence suggesting that gradual individual senescence is probably more frequent in natural populations of perennial plants than previously thought (Silvertown et al. 2001; Munné-Bosch 2008, 2015; Roach and Smith 2020).
The population average for the lifetime fecundity schedule was only weakly representative of the broad range of individual schedules actually occurring in the sample of L. latifolia plants studied, whose general shapes, temporal landmarks and shape descriptors varied widely among individuals. The lifetime fecundity schedule represents a keystone component in the demography of populations and the evolution of life history traits (Lewontin 1965; Harper 1977; Stearns 1992), yet I was unable to locate any published research reporting individual lifetime fecundity schedules for woody plants. Instances of broad individual variability in supra-annual patterns of fruit production have been frequently reported for tropical and temperate woody plants (e.g. Janzen 1978; Crawley and Long 1995; Herrera 1998; Munilla and Guitián 2014, Pérez-Ramos et al. 2014), but these data are poor indicators of individual lifetime schedules because they ordinarily refer to plants of unknown age and comprise periods much shorter than the presumed reproductive lifespan. It is not possible therefore to know the extent to which the large individual variability found here for L. latifolia is a general characteristic of individual lifetime schedules of woody plants.
The practical difficulties inherent to collecting the data needed for elucidating individual fecundity schedules of long-lived plants have been emphasized many times (Harper and White 1974; Janzen 1978; Clarke 1992; Salguero-Gómez et al. 2015). For example, the modal duration of studies included in the initial version of the comprehensive COMPADRE database on plant demography was "4 years, corresponding to the length of an average PhD project, as well as that of most funding agencies" (Salguero-Gómez et al. 2015, p. 213). The modal duration of studies subsequently declined to 3 years in the most recent version (COMPADRE 6.23.5.0, accessed 8 March 2024), where only 0.85% of the studies included (N = 8823) were on trees/shrubs and had a duration ≥25 years. Since 62% of the angiosperms are woody species (Zanne et al. 2014), their underrepresentation in demographic studies speaks of the practical difficulties noted above and denotes a considerable bias in the demographic information available for plants. Statistical methods devised to circumvent limitations imposed by unknown plant age and fragmentary fecundity data can successfully estimate average lifetime schedules and other demographic parameters at the population or species levels (Clarke 1992; Silvertown et al. 2001; Jones et al. 2014; Wenk and Falster 2015; Caswell 2019). These estimates are valid for comparative purposes (Silvertown et al. 2001; Jones et al. 2014; Wenk and Falster 2015; Qiu et al. 2021), but the lack of empirical information on the magnitude of individual variation in lifetime parameters prevents formal statistical testing of differences between species or populations, since uncertainty around average estimates cannot be evaluated (van Daalen and Caswell 2017). Most importantly, average schedules for groups of individuals do not allow for tests of the relationships between individual fitness and features of lifetime fecundity schedules which have been historically hypothesized to underly life history evolution (see references in Introduction).
Selection on lifetime fecundity schedule
The phenotypic selection analysis revealed strong, significant relationships between all landmark and shape parameters of individual lifetime schedules and the surrogate used here to estimate the relative fitness of L. latifolia individuals (cumulative lifetime production of inflorescences divided by the average for all individuals). Selection gradients on landmark parameters involved positive directional selection on age at last reproduction, and negative directional selection on age at first reproduction and total lifespan, which revealed that individuals combining early start of reproduction, long reproductive lifespan, and short total lifespan were at relative fecundity advantage. Selection on shape parameters involved both directional (negative on variance and kurtosis) and quadratic (stabilizing on the mean, disruptive on variance and kurtosis) components, again reflecting that everything else being equal certain shapes of lifetime fecundity schedules had relative fitness advantage over others. Selection on the set of descriptive parameters of lifetime schedules was consistently strong, as revealed by the high absolute values of bi (median |bi| = 1.44, range = 0.22-1.66) and gi (median |gi| = 0.51, range = 0.06-1.70). These figures fall in the uppermost quantiles of the distributions of (absolute) selection gradients previously reported for all types of traits in natural or seminatural plant populations, including life history features (see Kingsolver et al. 2001; Siepielski et al. 2009; Kingsolver and Diamond 2011; Caruso et al. 2018, 2020; for comprehensive reviews of phenotypic selection studies). It is not possible to elucidate whether the higher selection gradients found here in relation to most previous phenotypic selection studies stem from the type of traits considered, the lifetime nature of the fitness surrogate data (lack of estimates of lifetime fitness is "a major fault of most studies of natural selection"; Endler 1986, p. 162), or some combination of both.
The usual caveats raised on phenotypic selection approaches, particularly those questioning inferences of causality drawn from trait-fitness relationships (Svensson 2023), apply also to the present study, since it is not possible to identify the proximate selective mechanism(s) accounting for the strong selection observed on landmark and shape parameters of individual lifetime fecundity schedules. Furthermore, the phenotypic selection analysis conducted here was based on a proxy of maternal rather than overall fecundity data, which should consider the number of seeds produced plus seeds sired (but see Herrera 2001 for results documenting similar patterns of selection on the maternal and paternal components of reproductive success in L. latifolia). Yet another difficulty, specifically associated with lifetime trajectories, is the fact that individual differences in "arithmetic" fecundity estimates could diverge from actual differences due to possible age-dependent relationships between estimated and realized fecundity. Keeping all these caveats in mind, however, it is worth noting that results of this study are among the few instances to date of empirical support to some central tenets of life history evolution theory in a within-population context. Regarding landmark parameters, the strong negative directional selection on age at first reproduction found here agrees with the selective value consistently attached to reproductive precocity in models of life history evolution, particularly in the case of species with colonizing, expanding populations (Cole 1954; Lewontin 1965; Stearns 1976, 1992; Harper 1977) such as L. latifolia and, more generally, Mediterranean woody plants whose populations are exposed to recurrent wildfires (Guiote and Pausas 2023). Positive directional selection on reproductive lifespan also agrees with some assumptions of life history theory (Stearns 1992). Shape parameters of lifetime fecundity schedules have been rarely considered in theoretical formulations of life history evolution, but selection on mean, variance and skewness found here are implicit in some of the hypothesized scenarios envisaged by Lewontin (1965) under his "generalized triangular reproductive function".
Phenotypes as trajectories
The significance of ontogenetic changes in long-lived plants has been previously considered in a variety of ecological and evolutionary contexts, but there have been few attempts at placing the phenomenon in the conceptual framework of an expanded definition of plant phenotypes (but see, e.g. Harder et al. 2004; Herrera 2009; Chitwood and Topp 2015; Kulbaba et al. 2017; Harder et al. 2019; Herrera et al. 2021; Barton 2024). The set of landmark and shape features used here to characterize the lifetime schedules of growth and reproduction of individual L. latifolia plants represent a description of the way in which individual genotypes unfolded over its lifetime regarding two important facets of its external (i.e. phenotypic) appearance, namely plant size and annual number of inflorescences. The heterogeneous assortment of shapes depicted in Figure 2 portrays an assembly of "visible and measurable appearances" (Wanscher 1975, p. 144) of monitored plants, and hence are genuine elements of their phenotypes. Further support to the notion of phenotypes as trajectories was provided by the finding that selection was somehow able to "see" the variation existing among individuals, so that these individual differences were eventually related to lifetime fecundity. The possible evolutionary significance of selection on phenotypic trajectories will obviously depend on whether the causal mechanisms responsible for individual differences in lifetime schedules have some heritable basis (van Daalen and Caswell 2017). Given the considerable evidence supporting a role of genetic and (heritable) epigenetic control on individual development, growth and reproduction in plants (Bogan and Yil. 2024; Mitchell‐Olds 1996a, b; Turck and Coupland 2013; Kottler et al. 2018; Herrera et al. 2019), and the considerable genetic and epigenetic diversity exhibited by the marked population of L. latifolia studied (Herrera and Bazaga 2016), it seems plausible to speculate that observed individual differences in lifetime trajectories were at least in part due to heritable factors. Unfortunately, the long time required for estimating the heritability of lifetime schedule parameters using quantitative genetics methods based on controlled crosses and parent-offspring correlations will in fact render such heritability estimates unknowable for most woody plants.
While the concepts of gene and genotype have been a recurrent topic of discussion throughout the history of genetics (Roll-Hansen 2014), the description and use of the closely associated concept of phenotype have remained remarkably stable and undebated since its inception more than a century ago (Wanscher 1975; Herrera 2024a). There are reasons, however, for revising the concept of phenotype in the case of modularly-built, nonunitary organisms with indeterminate growth such as plants and some colonial animals (Chitwood and Topp 2015; Herrera 2024a). On one side, there is the need of accommodating instantaneous intra-individual variability in features of reiterated organs into the concept of phenotype by treating such variation as trait distributions rather than a simple average (Herrera 2024a). On the other hand, plants that grow, develop and reproduce over long periods demand the incorporation of individual lifetime trajectories as a critical temporal dimension of their respective phenotypes, as motivated in the Introduction to this article and supported by the results presented.
Understanding the genotype-phenotype relationship was a major goal of the research agenda in genetics and evolutionary biology during the last century (Sturtevant 1965; Lewontin 1974; Falconer 1981; Noble 2015). This research tradition paid most attention to unraveling the genetic underpinnings of phenotypic traits and the mechanisms whereby genetic background accounted for the organisms' appearance. In contrast, little effort has been historically devoted to scrutinizing whether the original Johannsenian definition of phenotype (Johannsen 1909, 1911) suited equally well to all kinds of organisms or, alternatively, should in certain groups be superseded by a more elaborate concept (Herrera 2024a, and present study). An updated definition of phenotype should incorporate the ontogenetic, developmental and architectural peculiarities of organisms, particularly the multiplicity of nonidentical structures produced by single genotypes and the protracted period of steady phenotypic unfolding arising from ontogenetic shifts, growth schedules and internal modular dynamics.
Acknowledgments
People helping with plot maintenance and plant monitoring over nearly four decades, or providing ideas and discussion on this project, are too numerous to remember or mention individually. Among them, special thanks are due to Manolo Carrión (†), Pedro Jordano, Roger Jovani, Luis López-Soria and Dori Ramírez. I am indebted to Conchita Alonso, Mónica Medrano, Juli Pausas, Rubén Torices and two anonymous reviewers for valuable suggestions which significantly improved an earlier version of the manuscript. Consejería de Medio Ambiente, Junta de Andalucía, provided permission to work in Sierra de Cazorla along with invaluable facilities. While writing this article I benefitted from grants from Ministerio de Ciencia, Innovación y Universidades (PID2022-141530NB-C22, DISTEPIC) and Generalitat de Valencia (PROMETEO-2021/040, FocScales).
Data Accessibility
Raw data used in this study (Herrera 2024b) are available in figshare at https://doi.org/10.6084/m9.figshare.27653352.v1.
Conflict of interest
The author declares he has no conflict of interest.
References
Adams, D.C., Collyer, M.L. 2009. A general framework for the analysis of phenotypic trajectories in evolutionary studies. Evolution 63, 1143–1154.
Alonso, C., Pérez, R., Bazaga, P., Medrano, M., Herrera, C.M. 2018. Within-plant variation in seed size and inflorescence fecundity is associated with epigenetic mosaicism in the shrub Lavandula latifolia (Lamiaceae). Annals of Botany 121, 153–160.
Barton, K.E. 2024. The ontogenetic dimension of plant functional ecology. Functional Ecology 38, 98–113.
Bates, D., Maechler, M., Bolker, B., Walker, S. 2015. Fitting linear mixed-effects models using lme4. Journal of Statistical Software 67, 1–48.
Billman, E.J., Rasmussen, J.E., Creighton, J.C., Johnson, J.B., Belk, M.C. 2014. A multivariate approach to the analysis of within lifetime variation in life history. Methods in Ecology and Evolution 5, 797–805.
Bogan, S.N., Yi, S.V. 2024. Potential role of DNA methylation as a driver of plastic responses to the environment across cells, organisms, and populations. Genome Biology and Evolution 16(2), evae022.
Caruso, C.M., Eisen, K.E., Martin, R.A., Sletvold, N. 2018. A meta-analysis of the agents of selection on floral traits. Evolution 73, 4–14.
Caruso, C.M., Maherali, H., Martin, R.A. 2020. A meta-analysis of natural selection on plant functional traits. International Journal of Plant Sciences 181, 44–55.
Caswell, H. 2019. Sensitivity analysis: matrix methods in demography and ecology. Springer, Cham, Switzerland.
Chitwood, D.H., Topp, C.N. 2015. Revealing plant cryptotypes: defining meaningful phenotypes among infinite traits. Current Opinion in Plant Biology 24, 54–60.
Clarke, P.J. 1992. Predispersal mortality and fecundity in the grey mangrove (Avicennia marina) in southeastern Australia. Australian Journal of Ecology 17, 161–168.
Cole, L.C. 1954. The population consequences of life history phenomena. Quarterly Review of Biology 29, 103–137.
Coleman, J. S., McConnaughay, K.D.M., Ackerly, D.D. 1994. Interpreting phenotypic variation in plants. Trends in Ecology and Evolution 9, 187–191.
Crawley, M.J., Long, C.R. 1995. Alternate bearing, predator satiation and seedling recruitment in Quercus robur L. Journal of Ecology 83, 683–696.
Endler, J.A. 1986. Natural selection in the wild. Princeton University Press, Princeton, New Jersey, USA.
Falconer, D.S. 1981. Introduction to quantitative genetics. Second edition. Longmans, London, UK.
Fox, J., Weisberg, S. 2019. An R companion to applied regression. Third edition. Sage, Thousand Oaks, California, USA.
Goodger, J.Q.D., Gleadow, R.M., Woodrow, I.E. 2006. Growth cost and ontogenetic expression patterns of defence in cyanogenic. Eucalyptus spp. Trees 20, 757–765.
Greenwood, M.S., Ward, M.H., Day, M.E., Adams, S.L., Bond, B.J. 2008. Age-related trends in red spruce foliar plasticity in relation to declining productivity. Tree Physiology 28, 225–232.
Guiote, C., Pausas, J.G. 2023. Fire favors sexual precocity in a Mediterranean pine. Oikos 2023, e09373.
Hallé, F. 1986. Modular growth in seed plants. Philosophical Transactions of the Royal Society of London B, Biological Sciences 313, 77–87.
Hallé, F., Oldeman, R.A.A., Tomlinson, P.B. 1978. Tropical trees and forests. An architectural analysis. Springer-Verlag, Berlin, Germany.
Harder, L.D., Jordan, C.Y., Gross, W.E., Routley, M.B. 2004. Beyond floricentrism: the pollination function of inflorescences. Plant Species Biology 19, 137–148.
Harder, L.D., Strelin, M.M., Clocher, I.C., Kulbaba, M.W., Aizen, M.A. 2019. The dynamic mosaic phenotypes of flowering plants. New Phytologist 224, 1021–1034.
Harper, J.L. 1977. Population biology of plants. Academic Press, London, UK.
Harper, J.L., White, J. 1974. The demography of plants. Annual Review of Ecology and Systematics 5, 419–463.
Herrera, C.M. 1987. Components of pollinator 'quality': comparative analysis of a diverse insect assemblage. Oikos 50, 79–90.
Herrera, C.M. 1988. Variation in mutualisms: the spatio-temporal mosaic of a pollinator assemblage. Biological Journal of the Linnean Society 35, 95–125.
Herrera, C.M. 1991. Dissecting factors responsible for individual variation in plant fecundity. Ecology 72, 1436–1448.
Herrera C.M. 1998. Population-level estimates of interannual variability in seed production: What do they actually tell us? Oikos 82, 612–616.
Herrera, C.M. 2000. Individual differences in progeny viability in Lavandula latifolia: a long-term field study. Ecology 81, 3036–3047.
Herrera, C.M. 2001. Deconstructing a floral phenotype: Do pollinators select for corolla integration in Lavandula latifolia? Journal of Evolutionary Biology 14, 574–584.
Herrera, C.M. 2009. Multiplicity in unity. Plant subindividual variation and interactions with animals. University of Chicago Press, Chicago, Illinois, USA.
Herrera, C.M. 2024a. Plant phenotypes as distributions: Johannsen's beans revisited. American Naturalist 203, 219–229.
Herrera, C.M. 2024b. Lifetime fecundity and size in the Mediterranean shrub Lavandula latifolia (Lamiaceae). Figshare. Dataset. https://doi.org/10.6084/m9.figshare.27653352
Herrera, C.M., Bazaga, P. 2016. Genetic and epigenetic divergence between disturbed and undisturbed subpopulations of a Mediterranean shrub: a 20-year field experiment. Ecology and Evolution 6, 3832–3847.
Herrera, C.M., Jovani, R. 2010. Log-normal distribution of individual lifetime fecundity: insights from a 23-yr study. Ecology 91, 422–430.
Herrera, C.M., Medrano, M., Pérez, R., Bazaga, P., Alonso, C. 2019. Within-plant heterogeneity in fecundity and herbivory induced by localized DNA hypomethylation in the perennial herb Helleborus foetidus. American Journal of Botany 106, 798–806.
Herrera, C.M., Bazaga, P., Pérez, R., Alonso, C. 2021. Lifetime genealogical divergence within plants leads to epigenetic mosaicism in the shrub Lavandula latifolia (Lamiaceae). New Phytologist 231, 2065–2076.
Janzen, D.H. 1978. Seeding patterns of tropical trees. In: Tomlinson, P.B., Zimmermann, M.H. (eds.). Tropical trees as living systems, pp. 83-128. Cambridge University Press, Cambridge, UK.
Ji, M., Jin, G., Liu, Z. 2021. Effects of ontogenetic stage and leaf age on leaf functional traits and the relationships between traits in Pinus koraiensis. Journal of Forestry Research 32, 2459–2471.
Johannsen, W. 1909. Elemente der exakten Erblichkeitslehre. Gustav Fischer, Jena, Germany.
Johannsen, W. 1911. The genotype conception of heredity. American Naturalist 45, 129–159.
Jones, O.R., Scheuerlein, A., Salguero-Gomez, R., Camarda, G.C., Schaible, R., Casper, B.B., Dahlgren, J.P., et al. 2014. Diversity of ageing across the tree of life. Nature 505, 169–173.
Kingsolver, J.G., Hoekstra, H.E., Hoekstra, J.M., Berrigan, D., Vignieri, S.N., Hill, C.E., Hoang, A., et al. 2001. The strength of phenotypic selection in natural populations. American Naturalist 157, 245–261.
Kingsolver, J.G., Diamond, S.E. 2011. Phenotypic selection in natural populations: what limits directional selection? American Naturalist 177, 346–357.
Kottler, E.J., VanWallendael, A., Franks, S.J. 2018. Experimental treatment with a hypomethylating agent alters life history traits and fitness in Brassica rapa. Journal of Botany 2018, 7836845.
Kulbaba, M.W., Clocher, I.C., Harder, L.D. 2017. Inflorescence characteristics as function‐valued traits: analysis of heritability and selection on architectural effects. Journal of Systematics and Evolution 55, 559–565.
Lande, R., Arnold, S.J. 1983. The measurement of selection on correlated characters. Evolution 37, 1210–1226.
Lewontin, R.C. 1965. Selection for colonizing ability. In: Baker. H.G., Stebbins, G.L. (eds.). The genetics of colonizing species, pp. 235-253. Academic Press, New York, USA.
Lewontin, R.C. 1974. The genetic basis of evolutionary change. Columbia University Press, New York, USA.
Lüdecke, D. 2018. ggeffects: Tidy data frames of marginal effects from regression models. Journal of Open Source Software 3, 772.
Lüdecke, D., Ben-Shachar, M.S., Patil, I., Waggoner, P., Makowski, D. 2021. performance: An R package for assessment, comparison and testing of statistical models. Journal of Open Source Software 6, 3139.
Mitchell‐Olds, T. 1996a. Genetic constraints on life‐history evolution: quantitative‐trait loci influencing growth and flowering in Arabidopsis thaliana. Evolution 50, 140–145.
Mitchell‐Olds, T. 1996b. Pleiotropy causes long‐term genetic constraints on life‐history evolution in Brassica rapa. Evolution 50, 1849–1858.
Munné-Bosch, S. 2008. Do perennials really senesce? Trends in Plant Science 13, 216–220.
Munné-Bosch, S. 2015. Senescence: is it universal or not? Trends in Plant Science 20, 713–720.
Munilla, I., Guitián, J. 2014. Long-term individual-level variation of reproductive features in Sorbus aucuparia, a fleshy-fruited tree. Trees 28, 1489–1496.
Nakagawa, S., Schielzeth, H. 2013. A general and simple method for obtaining R2 from generalized linear mixed-effects models. Methods in Ecology and Evolution 4, 133–142.
Noble, D. 2015. Evolution beyond neo-Darwinism: a new conceptual framework. Journal of Experimental Biology 218, 7–13.
Pérez-Ramos, I.M., Aponte, C., García, L.V., Padilla-Díaz, C.M., Marañón, T. 2014. Why is seed production so variable among individuals? A ten-year study with oaks reveals the importance of soil environment. PLoS ONE 9, e115371.
Qiu, T., Aravena, M.-C., Andrus, R., Ascoli, D., Bergeron, Y., Berretti, R., Bogdziewicz, M., et al. 2021. Is there tree senescence? The fecundity evidence. Proceedings of the National Academy of Sciences USA 118, e2106130118.
R Core Team 2023. R: A language and environment for statistical computing. R Foundation for Statistical Computing, Vienna, Austria. https://www.R-project.org/
Roach, D.A., Smith, E.F. 2020. Life-history trade-offs and senescence in plants. Functional Ecology 34, 17–25.
Roll-Hansen, N. 2014. The holist tradition in twentieth century genetics. Wilhelm Johannsen's genotype concept. Journal of Physiology 592, 2431–2438.
Salguero-Gómez, R., Jones, O.R., Archer, C.R., Buckley, Y.M., Che-Castaldo, J., Caswell, H., Hodgson, D., et al. 2015. The COMPADRE Plant Matrix Database: an open online repository for plant demography. Journal of Ecology 103, 202–218.
Siepielski, A.M., DiBattista, J.D., Carlson, S.M. 2009. It's about time: the temporal dynamics of phenotypic selection in the wild. Ecology Letters 12, 1261–1276.
Silvertown, J., Franco, M., Perez-Ishiwara, R. 2001. Evolution of senescence in iteroparous perennial plants. Evolutionary Ecology Research 3, 393–412.
Stearns, S.C. 1976. Life-history tactics: a review of the ideas. Quarterly Review of Biology 51, 3–47.
Stearns, S.C. 1992. The evolution of life histories. Oxford University Press, Oxford, UK.
Steppe, K., Niinemets, Ü., Teskey, R.O. 2011. Tree size- and age-related changes in leaf physiology and their influence on carbon gain. In: Meinzer, F.C., Lachenbruch, B., Dawson, T.E., (eds.). Size- and age-related changes in tree structure and function, pp. 235-253. Springer, Dordrecht, The Netherlands.
Stinchcombe, J.R., Agrawal, A.F., Hohenlohe, P.A., Arnold, S.J., Blows, M.W. 2008. Estimating nonlinear selection gradients using quadratic regression coefficients: double or nothing? Evolution 62, 2435–2440.
Sturtevant, A.H. 1965. A history of genetics. Harper and Row, New York, USA.
Svensson, E.I. 2023. Phenotypic selection in natural populations: what have we learned in 40 years? Evolution 77, 1493–1504.
Turck, F., Coupland, G. 2013. Natural variation in epigenetic gene regulation and its effects on plant developmental traits. Evolution 68, 620–631.
van Daalen, S.F., Caswell, H. 2017. Lifetime reproductive output: individual stochasticity, variance, and sensitivity analysis. Theoretical Ecology 10, 355–374.
Wanscher, J.H. 1975. The history of Wilhelm Johannsen's genetical terms and concepts from the period 1903 to 1926. Centaurus 19, 125–147.
Watkinson, A.R., White, J. 1985. Some life-history consequences of modular construction in plants. Philosophical Transactions of the Royal Society of London, Series B 313, 31–51.
Wenk, E.H., Falster, D.S. 2015. Quantifying and understanding reproductive allocation schedules in plants. Ecology and Evolution 5, 5521–5538.
White, J. 1979. The plant as a metapopulation. Annual Review of Ecology and Systematics 10, 109–145.
Zanne, A.E., Tank, D.C., Cornwell, W.K., Eastman, J.M., Smith, S.A., FitzJohn, R.G., McGlinn, D.J., et al. 2014. Three keys to the radiation of angiosperms into freezing environments. Nature 506, 89–92.